
Despite 2020 being a crazy time for the retail industry, there’s much to be learned from 2020 retail data.
With 2020 in the rearview mirror, objects are rapidly becoming further away than they appear.
WHAT’S IN THIS WEEKS EDITION, YOU ASK?
- See how 2020 retail data compares to 2019
- There is a new and enhanced algorithm for the Daily Retail Traffic Index
- Watch this video on traffic blindness and see what you can do about it
- Online furniture stores to keep your eye on in 2021
- No more homeless mice thanks to the makers of mice-homes in the streets of Europe
And, here’s what’s in next week’s edition: 2021 better habits
A new year is always a good excuse to scratch our heads and see what we can be doing better.
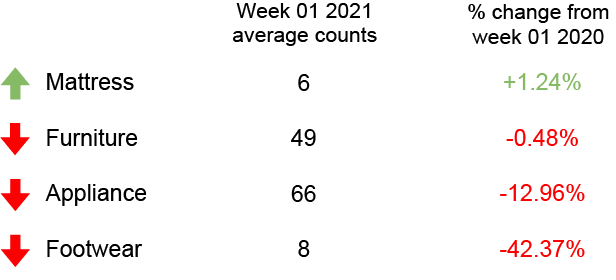
FOOT TRAFFIC INDEX
Here’s a look at last week’s foot traffic compared to the same time last year.
DC FEATURE OF THE WEEK
This is where each week we highlight a feature within Doorcounts. This week’s feature is:
The Excludes tab
Excluding photos can be a great way to keep your counts as accurate as possible, but for a manager, it can be seen as an excuse for salespeople not to help a customer.
To see exactly where the excludes are coming from, the charts filter by Exclude reason, location, salesperson, and by time threshold.
FOOT TRAFFIC TRENDS
Industry insights so you can convert your foot traffic into more sales.
No-one in their right mind could have predicted how 2020 would have played out for the retail industry. As we look back at the key insights, let’s remember that 2020 was in no way a normal year.
2020 retail data (furniture)
Despite everything that was thrown at the retail industry this year, it appears that 2020 was the year of buying furniture.
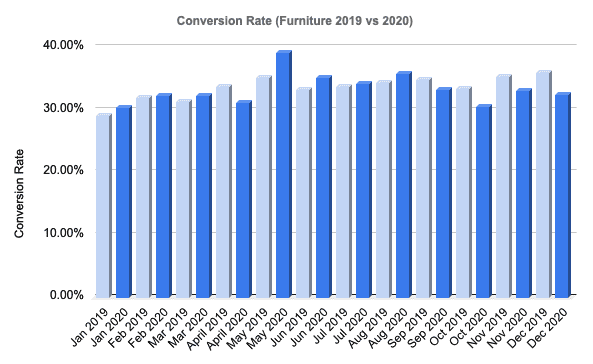
Conversion rate
Overall, the furniture industry saw a 0.56% decrease in conversion rate over 2019. Conversion rate stayed extremely consistent though out 2020 with only a minor drop in October. As we’ve said before, we salute furniture salespeople’s ability to convert during a pandemic.
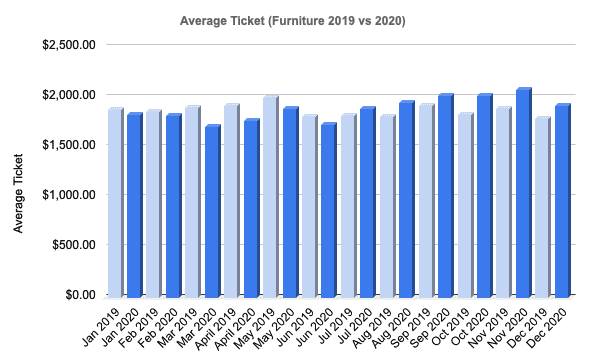
Daily average ticket
The two-year high for daily average ticket was $2,077 in November 2020, with the low being $1,707 in March of 2020.
Throughout the last two years, daily average ticket has only fluctuated around $300 — pretty impressive. Overall, daily average ticket saw a 0.81% increase in 2020.
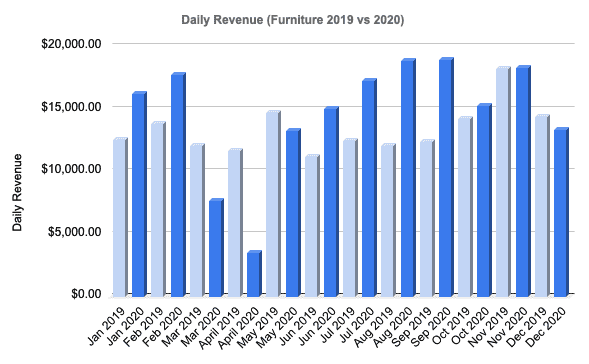
Daily revenue
Daily revenue is where we really get to see the effects of the pandemic and lockdowns throughout retail. In April of 2020, we can clearly see the massive impact the first round of lockdowns had on the furniture industry.
Although daily revenue dropped to $3,553 in April, the furniture industry made a remarkable comeback in the months to come with September seeing a daily revenue of $18,924.
Compared to 2019, the furniture industry saw a 9.82% increase in daily revenue.
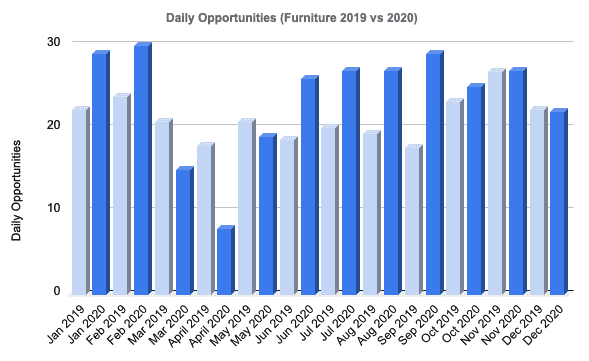
Daily opportunities
Similar to daily revenue, the furniture industry saw a major drop in foot traffic in April of 2020. Compared to last April when everything was peachy in the world, the furniture industry saw a 55.49% decrease in foot traffic.
Thanks to customers continuing to shop in the months to come, the furniture industry surprisingly ended the year with an 11.76% increase in foot traffic.
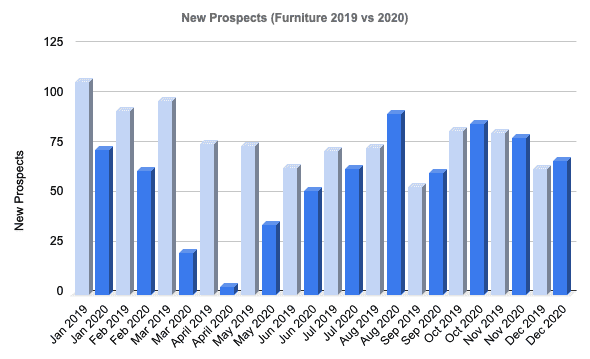
New prospects
As we’ve mentioned before, new prospects are another way to say shoppers who left the store without buying. To see new prospects decrease year over year would be a major plus.
In 2020, the furniture industry saw 25.97% fewer people leave their store without buying.
2020 retail data (mattress)
In 2019, most mattress customers had begun to upgrade to Doorcounts 3.0 with full performance metrics vs the previous version with traffic counting only. It is not until June of 2019 that we start to see the data necessary to provide meaningful insights.
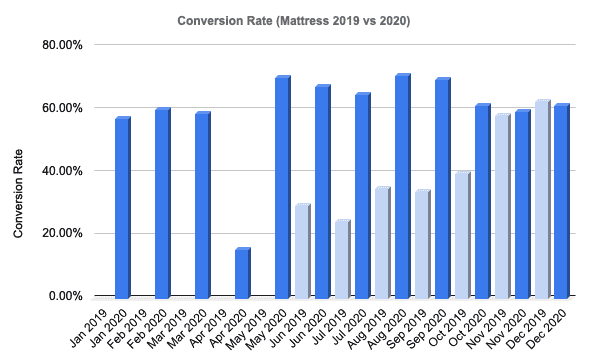
Conversion rate
Compared to 2019, the mattress industry saw a 47.77% increase in sales conversion. (Most stores had just started using Doorcounts 3.0 with full performance tracking in May of 2019, which may have resulted in a lower than average conversion rate)
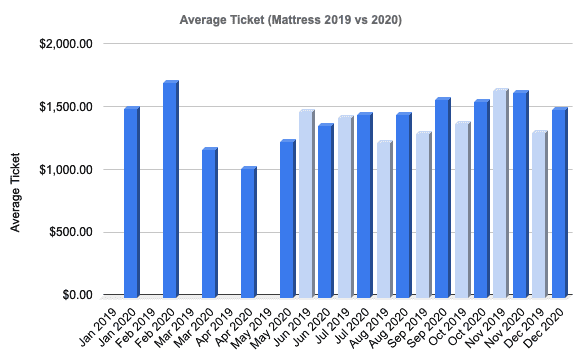
Average ticket
Despite most mattress customers being new to Doorcounts 3.0 in 2019, most customers were able to enter their sales data right away.
Average ticket stayed extremely consistent over the last two years with the mattress industry seeing a 2.29% increase in average ticket in 2020.
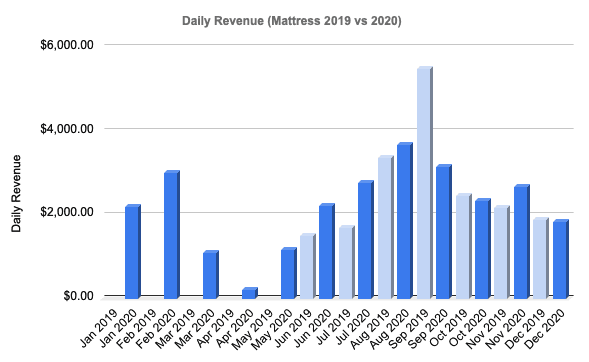
Daily revenue
Similar to the furniture industry, the mattress industry saw a major drop in daily revenue in April 2020 as lockdowns began.
Daily revenue saw its 12-month (2020) low in April with a daily revenue of $213, with the high being $3,690 in August.
Compared to 2019, the mattress industry saw a 17.13% decrease in daily revenue.
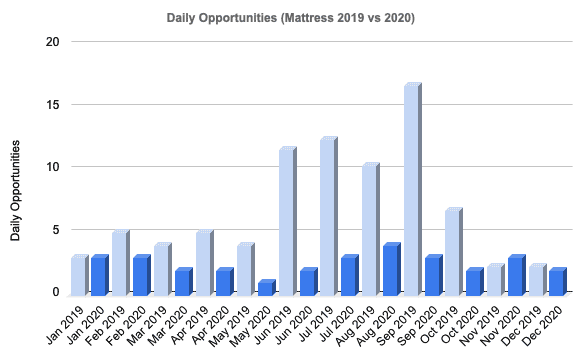
Daily opportunities
Unlike other metrics, daily opportunities in the furniture industry saw their biggest drop in May of 2020 with an average foot traffic of one person.
While foot traffic saw a major jump in the summer months of 2019, 2020 did not have the same result.
Overall, foot traffic dropped 64.13% in the mattress industry compared to 2019
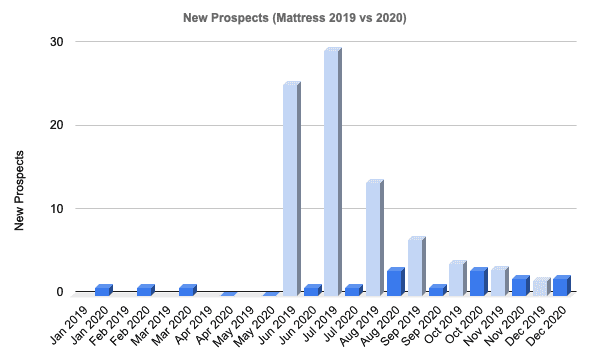
New prospects
As we’ve mentioned before, new prospects is a euphemism for shoppers who left the store without buying.
Due to people limiting their exposure and shopping trips in 2020, most shopping trips resulted in people making a purchase.
Throughout 2020, the mattress industry saw 88.85% fewer people leaving their store without buying.
How much money are you losing because of traffic blindness?