
So now our weekly wrap up and daily traffic index are part of our brand new newsletters: Retail Traffic Trends, or Traffic Trends for short. We were like, “Hey, we have all this knowledge piling up about retail foot traffic and we should share it with the world. Or at least our community of brick-and-mortar retailers.”
So that’s what we did.
Each week we dig into the data and share valuable insights that will help you convert your foot traffic into more sales. Enjoy!
WHAT’S IN THIS WEEK’S EDITION, YOU ASK? |
- Third-quarter year-over-year benchmark analysis reveals not so surprising insights.
- Dos Marcos releases their new book titled, Come Back To Bed, how to attract more traffic and make people fall in love with your store.
- How much money are you losing because of traffic blindness? — Watch this fun video we created.
- Much much more…
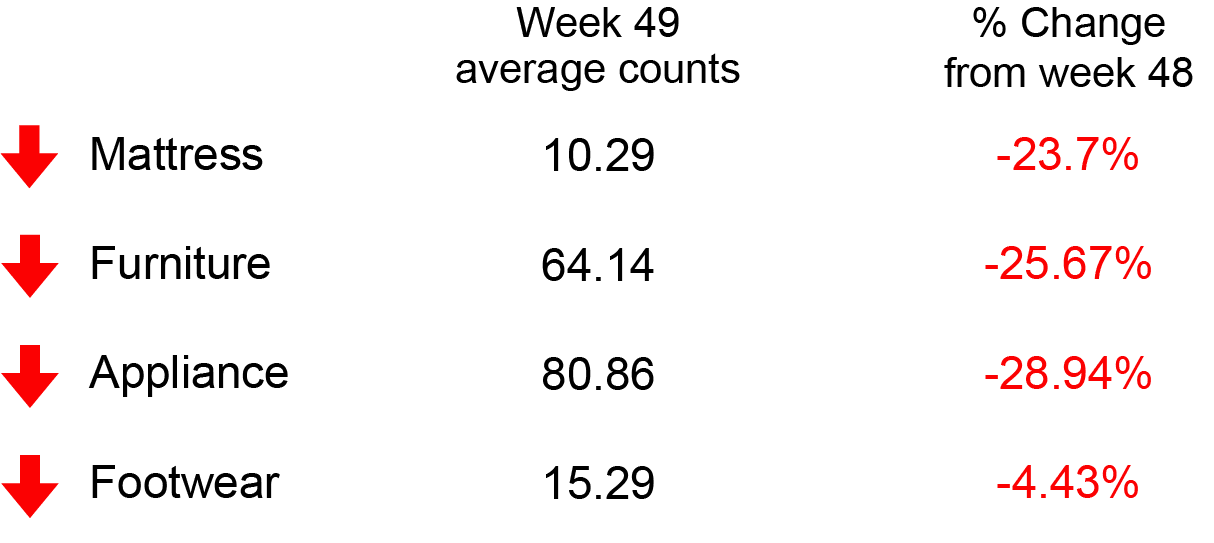
FOOT TRAFFIC INDEX (WK 48 vs 49)
FEATURE OF THE WEEK
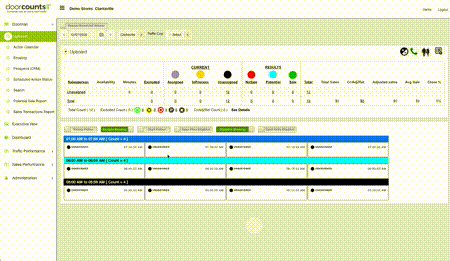
Display Scheduled Actions: On most days, salespeople spend most of their time waiting for the next shopper, rather than working with the next shopper. Why not give them a one-click option to follow-up with shoppers who’ve already visited and are in need of another contact?
The scheduled actions feature allows salespeople to see which customers they need to follow up with and allows them to reach out directly through Doorcounts.
FOOT TRAFFIC TRENDS
This week we are taking a look at the key metrics of Q3 2019 vs Q3 2020–not that 2019 and 2020 have anything in common. Check it out for yourself! But, you might be surprised, or the information might just simply validate what you already knew. Either way, we know it’s always better to understand what’s happening through the lens of objectivity.
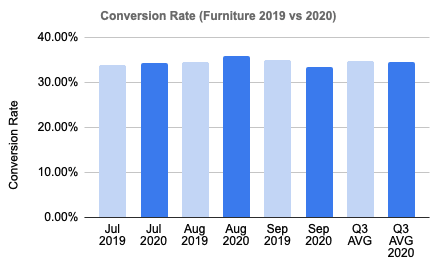
Q3 furniture key metrics (2019 vs 2020)
Conversion rate
Looking at this chart would make you believe that this was a completely normal year – it wasn’t. But somehow year-over-year conversion rate stayed extremely consistent with only a .50% decrease over 2019. It’s almost as if 60% of people walk into furniture stores just for the heck of it.
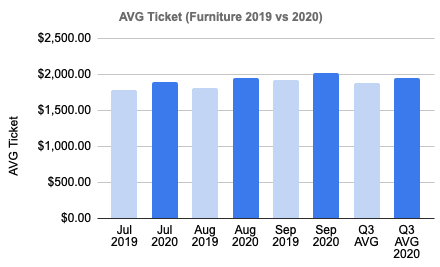
Average ticket
When people buy furniture, they tend to go big or go home. This year, it looks like people continued to go big. Year-over-year average ticket saw a slight increase of 4.4% over 2019. Most people knew they were going to spend more time in their living room than normal, which resulted in people spending more money on what they’re sitting on.
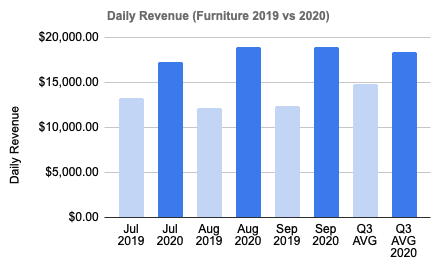
Daily Revenue
With all the time people are spending at home during quarantine, we know our families can’t be the only ones who thought “we need a better couch to spend all our time on.” Furniture seems to be one of the first “home improvements” people made during quarantine this year. With that being said, year-over-year daily revenue saw a bump in 2020. Daily revenue was up 24.4% from 2019 in the furniture industry.
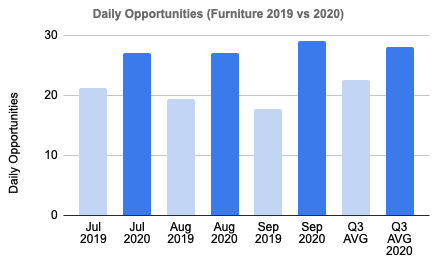
Daily opportunities
Opportunities are anyone who entered a store excluding vendors, salespeople, etc… When people prepared for lockdowns this year, there were two major items on most people’s lists: Toilet paper and new furniture. While the mattress industry saw a 65% decrease in year-over-year daily opportunities, the furniture industry saw a 23.08% increase.
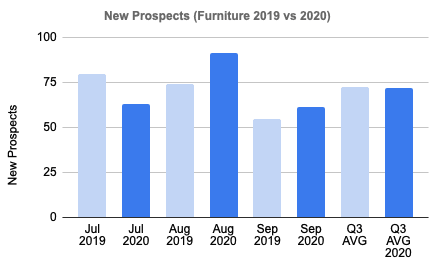
Daily prospects
Daily prospects, also known as potential sales, are people who walked out of the store without purchasing. It would be ideal for these numbers to decrease year-over-year, but unfortunately, that is not always the case. In August of 2020, nearly 100 people on average walked into a furniture store and decided not to buy. Luckily, fewer people left without buying in September as they decided their old couches just didn’t cut it anymore.
Q3 mattress key metrics (2019 vs 2020)
In 2019, most mattress customers had not yet upgraded to Doorcounts 3.0 with full metric tracking vs door counts only which can create a larger disparity in certain measurements. So in some cases, we may not have the best data, but we will in the future because we’ve been adding new mattress stores like crazy.
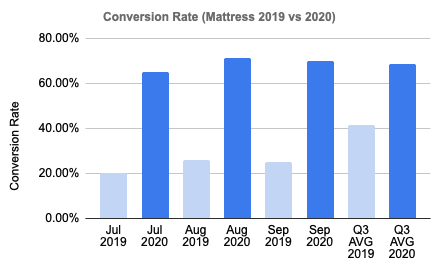
Conversion rate
This year people showed up to stores with their checkbooks out and ready to buy (or maybe salespeople found a clever new way to make more sales). The year-over-year conversion rate had a 66% increase over 2019. We don’t even work in the mattress industry yet this chart puts a big ol smile on our faces.
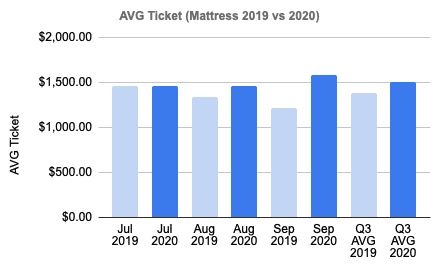
Average ticket
Fun fact: Average ticket for July in 2019 was the exact same as July 2020. They were so close in fact (within 30 cents) that we had to make sure the data was entered correctly – and it was. Year over year average ticket stayed constant for the mattress industry with an 8.23% increase from 2019.
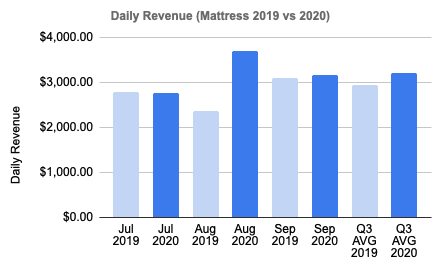
Daily revenue
While revenue saw its quarterly low during August of last year (probably due to everyone rushing to see the release of the new Angry Birds movie), August of 2020 saw record sales of nearly $3,700 a day. Year-to-year daily revenue had a similar trend as average ticket with a slow but steady 9.1% increase over 2019.
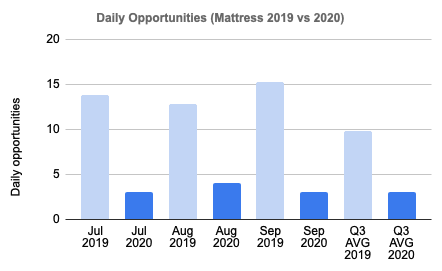
Daily opportunities
Opportunities are anyone who entered a store excluding vendors, salespeople, etc… Not as a surprise to many, daily opportunities saw a significant decrease year-over-year. The mattress industry went from hosting decent size parties to a party of 3 on most days. Overall 2020 saw a 65.8% decrease in foot traffic from 2019 in the mattress industry.
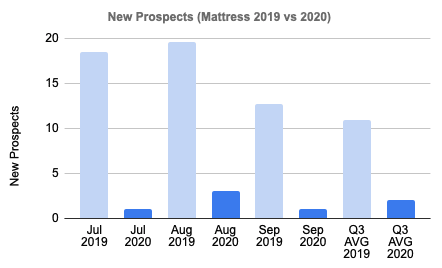
Daily prospects
Daily prospects, also known as potential sales, are people who walked out of the store without purchasing. Year-over-year daily prospects saw a 65.9% decrease over 2019. Luckily, that’s a good thing. A decrease in daily prospects means more people are leaving the store with a purchase in hand. CHA-CHING!
What about appliance, footwear, and other categories?
Based on the limited number of appliance and footwear customers, we are not able to provide meaningful data for year-over-year comparison at this time. However, with the number of new appliance and footwear customers coming on board, we will be able to next year.
How much money are you losing because of traffic blindness?
NOTEWORTHY NEWS
As you start your Wednesday, here’s a rundown of last week…
Disruptive generation: Gen Z’s tech-savvy ways and their focus on sustainability and activism has made them one of the most disruptive generations ever for retail and brand marketers.
Trend watch 2021: From contactless transactions to augmented and virtual reality, these are the rising technologies that will define the retail industry.
Shoptober: Shoppers keep their eye on electronics, aren’t Splurging Elsewhere.
Saving retail: Retailers are finding new ways to keep the retail experience alive.
Dos Marcos releases new book: Come Back To Bed is finally here, pick up their book here.
RANDOM IRRELEVANCE
The Grinch: I’m sure we can all relate that shipping delays have been more and more common this year. As e-commerce surges, UPS plans to enact shipping limits this holiday season.
T-shirt cash out: A student who collected every Supreme Box Logo Tee ever released at retail between 1994-2020 is expected to get a huge payday.
Steve Wozniak (2.0): The man, the myth, the legend behind Apple Steve Wozniak has started a new company.
Musk in the air: Short investors in Tesla have lost more than airline companiesthis year, over 35 billion dollars as Tesla stock skyrockets.
Thanks for reading this weeks’ newsletter! Not subscribed? Listen to Sparky below!