
Did you know mattress sales were up 183% in the second quarter of 2020 over 2019? Check out below to see other interesting facts about Q2 2020.
This week we take a deep dive into the quarters most impacted by Covid. Q2 was the first quarter most states were placed under lockdown restrictions, and for many, this resulted in their stores being forced to close.
WHAT’S IN THIS WEEK’S EDITION, YOU ASK?
- Second-quarter year-over-year benchmark report: How did Covid affect retail?
- Augmented reality: A showroom’s best friend or biggest rival?
- The underdog story: Amazon finally meets its match.
- Dos Marcos: How a single word shifted the mattress industry.
- Much much more…
Here’s what’s in next weeks edition:
Next week we will release our holiday edition. Make sure you don’t miss it or you might get a piece of coal in your stocking.
FOOT TRAFFIC INDEX
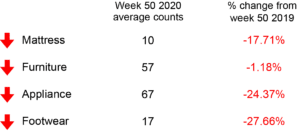
This week we decided to change up our traffic index a little bit. Instead of comparing last week to the week prior, we are now going to compare last week to the same time last year. We felt this was a more valuable comparison of how the year is going.
Last week, week 50, saw a 16.94% decrease over week 50 2019. All things considered, this is pretty good.
DC FEATURE OF THE WEEK
Dashboard: The dashboard allows managers to see multiple reports and sales statistics in one convenient place. Simply click which store and date range you are interested in and Doorcounts will do the rest.
Within the dashboard, you can compare your stores against one another, or take a deep dive into a specific store and see the data on a salesperson level.
FOOT TRAFFIC TRENDS
This week we are taking a look at the key metrics of Q2 2019 vs Q2 2020. If anything, we were able to confirm our theory that the retail industry can handle anything that is thrown at it.
Q2 furniture key metrics (2019 vs 2020)
It’s amazing to think about how different Q2 last year was from this year. Some great movies came out during Q2 of last year, and now the thought of going to a movie theater sounds preposterous. Luckily, everyone needs furniture to watch Netflix.
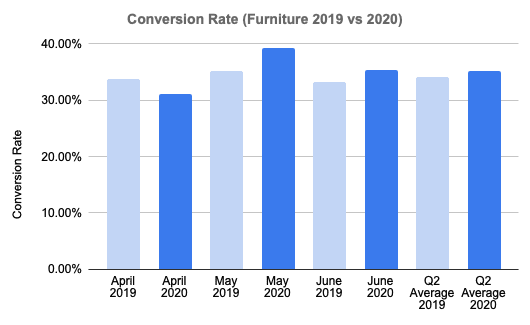
Conversion rate
Despite the crazy restrictions on the retail industry in Q2 this year, the furniture industry was able to show no fear. The year-over-year conversion rate had a 15% increase over Q2 2019. We recommend keeping your eyes on this chart for as long as possible, it doesn’t get much better after this.
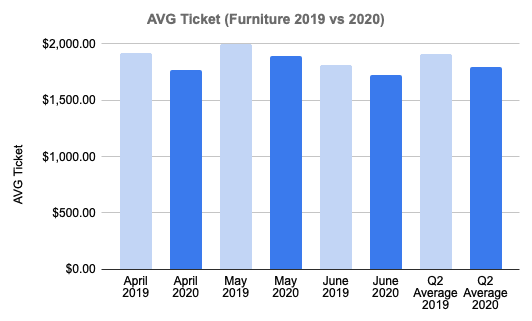
Average ticket
What’s second-best to an increase year-over-year? — a small decrease. With that kind of mindset, we are in luck. Year-over-year average ticket saw a 3% decrease from Q2 2019. Not bad at all.
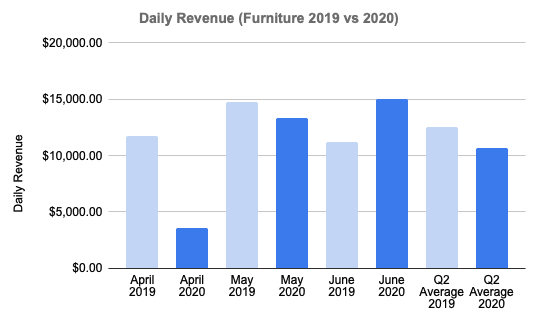
Daily revenue
We assumed daily revenue would completely drop, but similar to the mattress industry, the furniture industry was able to stay afloat. Year-over-year daily revenue saw a 15% decrease over 2019. It’s like traffic –It can slow you down but doesn’t completely stop you.
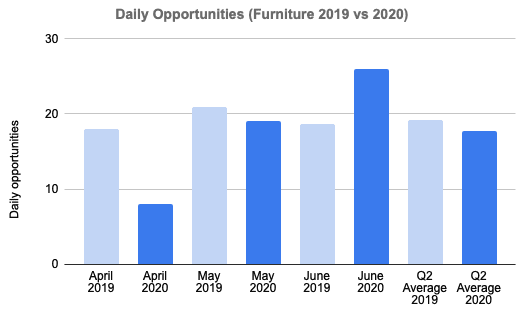
Daily opportunities
The furniture industry can sleep well knowing that their foot traffic stayed stable during a time when people were told to stay inside. Unlike the mattress industry who saw a 92% decrease in daily opportunities, Q2 2020 only saw an 8% decrease in foot traffic from 2019 in the mattress industry.
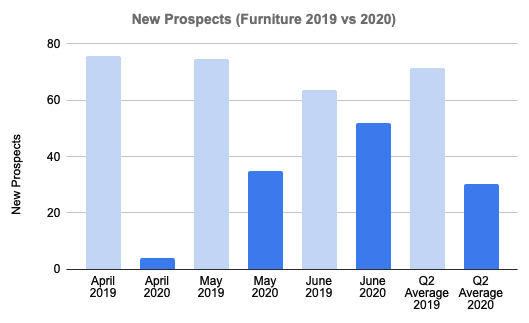
Daily prospects
Daily prospects is a fancy way to say people who left the store without buying (that is if your salespeople got their information before they left). Unfortunately for all the window shoppers out there, it looks like that trend may be coming to an end. Shoppers are going to stores to buy rather than look this year, which resulted in Q2 2020 seeing a 57% decrease in daily prospects from 2019 in the mattress industry.
Q2 mattress key metrics (2019 vs 2020)
In 2019, most mattress customers had not yet upgraded to Doorcounts 3.0 with full metric tracking vs door counts only which can create a larger disparity in certain measurements. So in some cases, we may not have the best data, but we will in the future because we’ve been adding new mattress stores like crazy.
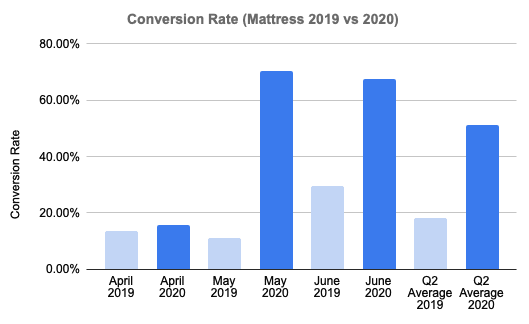
Conversion rate
Similar to Q3, those who showed up to stores this year, REALLY showed up. The year-over-year conversion rate had a 183% increase over Q2 2019. Last week we got hyped for the mattress industry, and this week we do the exact same (and then some.)
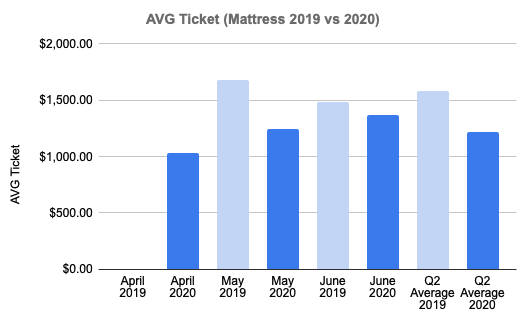
Average ticket
Year-over-year average ticket saw a 23% decrease from Q2 2019. Although salespeople are converting more sales, shoppers went from getting add-ons to looking for take-offs. On the bright side, the average ticket continues to increase month after month this year.
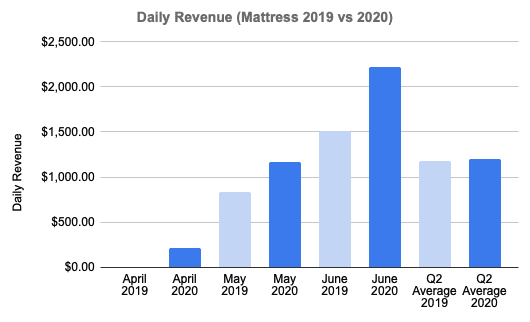
Daily revenue
When we first saw this chart, the first thing that came to our minds was Cingular Wireless (for those of you who remember their “Raising the Bar” ads.) Similar to 2019, daily revenue saw a solid growth throughout Q2 which resulted in a year-over-year increase of 2% over 2019.
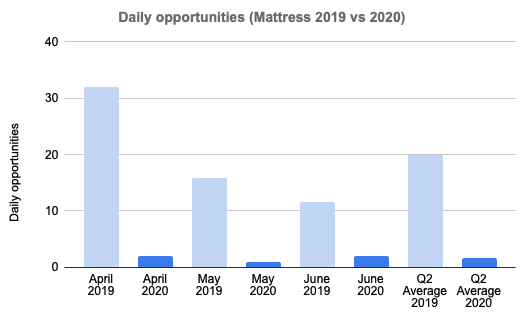
Daily opportunities
Overall, Q2 2020 saw a 92% decrease in foot traffic from 2019 in the mattress industry. Before we began sorting through the data, we assumed most of Q2 2020 would look exactly like this chart does. With major lockdowns throughout most cities in Q2, a 92% decrease is probably better than most would’ve expected. See the Q3 comeback in last week’s traffic trends.
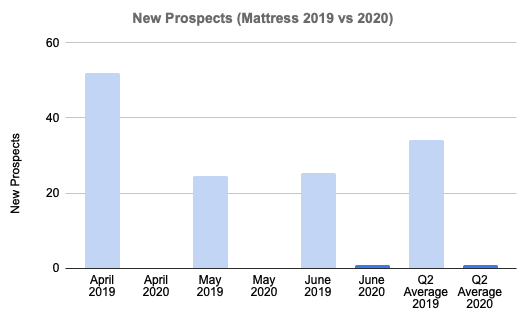
Daily prospects
Like we said last week, daily prospects is a fancy way to say people who left the store without buying (that is if your salespeople got their information before they left). Anytime we see daily prospects go down, it’s a sign that salespeople are doing something right (as they always do.) Q2 Year-over-year daily prospects saw a 97% decrease over 2019. People aren’t messing around about their sleep this year.
What about appliance, footwear, and other categories?
With the number of new appliance and footwear customers joining Doorcounts in 2020, our data continues to improve. However, based on limited 2019 performance data for appliance and footwear customers, we are not able to provide meaningful data for year-over-year comparison at this time.
The word that changed everything
When the trend switched from “spring” to “foam” mattresses, Leggett & Platt found itself in a difficult position.
They needed to flip the script. So they did.
…The “hybrid” was born.
Read the full story about how our very own Mark Kinsley, of Dos Marcos fame, turned a dire situation into a golden opportunity.

How much money are you losing because of traffic blindness?
Here’s a “mockumentary” style video on traffic blindness and how YOU can recognize the early signs of this silent killer of sales. Watch, enjoy a good laugh, and learn what you can do to cure your traffic blindness and convert your foot traffic into more sales.
Watch the video here.

NOTEWORTHY NEWS
As you start your Wednesday, here’s a rundown of last week…
Showrooms–at home?: See how augmented reality will change the showroom experience and help you sell more products.
Future of commerce: “The Future of Commerce 2021” is Shopify’s first annual report, using its global retailer and consumer data to predict changes in the retail landscape during the new year.
Stock watch: The holidays are prime time for retail stocks, but obviously things are very different this year. See which retail stocks to watch this December.
Shopping habits change job availabilities: The job market has done a flip as shoppers change their shopping habits.
How, where, and when: Spending patterns this shopping season show in-store purchases down 16% at department stores but up 212% online.
RANDOM IRRELEVANCE
Mt Everest…grows?: The world’s highest mountain Mount Everest is 0.86m higher than had been previously officially calculated, Nepal and China have jointly announced.
Boss ladies: See the women that are changing the world.
Amazon’s new biggest rival: Amazon has completely taken over the book market (and the world?) But things are about to change.
2020 in pictures: There are a lot of words that could be used to describe 2020. Instead, let’s look at some pictures that describe 2020.