
This week we how Valentine’s Day key metrics compare over the years and the relationship between mattress sales and Valentine’s day.
WHAT’S IN THIS WEEKS EDITION, YOU ASK?
- See how Valentine’s Day key metrics compare over the years
- The relationship between mattress sales and Valentines day
- Different ways to close the digital divide between online and physical stores
- Dos Marcos mattress podcast share..
- Turn your foot traffic into more sales with a 90-day free trial of Doorcounts 3.0.
And, here’s what’s in next week’s edition: TBD
FOOT TRAFFIC INDEX
Here’s a look at last week’s foot traffic compared to the same time last year.
DC FEATURE OF THE WEEK
This is where each week we highlight a feature within Doorcounts. This week’s feature is:
In the retail industry, getting a customer review quickly after the engagement is over can greatly enhance the review.
With Podium integrated into Doorcounts, you are able to request a customer review with the click of a Button as soon as the customer leaves the store
10 MATTRESS GALAXY PREDICTIONS FOR 2021 AND BEYOND
As a proud sponsor of the Dos Marcos Mattress Podcast, see how they use Doorcounts foot traffic data in their highly anticipated 2021 predictions episode.
FOOT TRAFFIC TRENDS
Industry insights so you can convert your foot traffic into more sales.
Although Valentine’s day is more known for flowers and chocolates these metrics may change your mind.
Valentine’s day key metrics (furniture industry)
This week we see the effect love has on buying furniture (probably not as strong as the effect on the mattress industry).
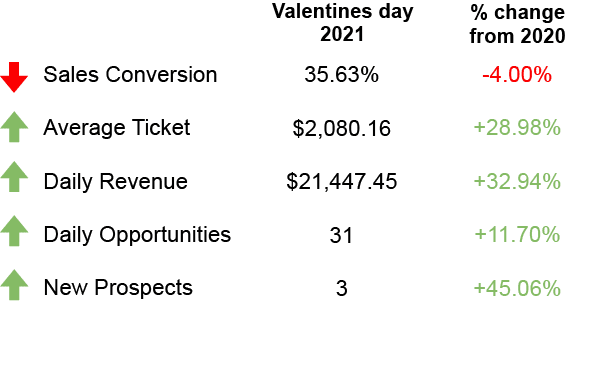
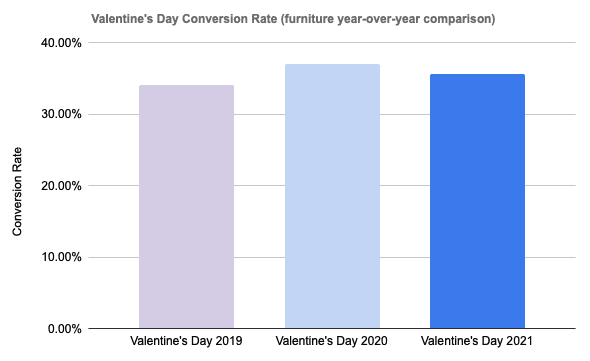
Conversion rate up 3%: Although the conversion rate is down 4% from Valentine’s day 2020, the furniture industry saw a 9 increase Valentine’s day 2019 to 2020.
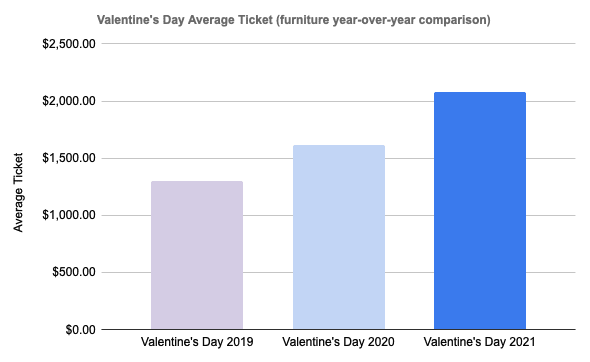
Average Ticket up 29%: Salespeople don’t mess around on Valentine’s day. In 2020, salespeople converted 25% more sales on Valentine’s day than in 2019, and they converted 29% more this year.
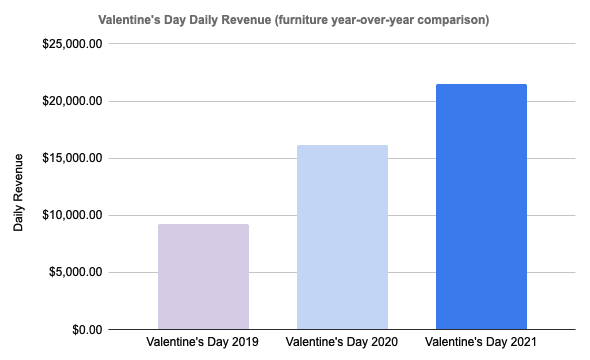
Daily Revenue up 33%: Average daily revenue usually sees a spike on weekends, but nothing like the spike on Valentine’s day. Average daily revenue was up 33% this Valentine’s day and was up 75% in 2020 compared to Valentine’s day 2019.
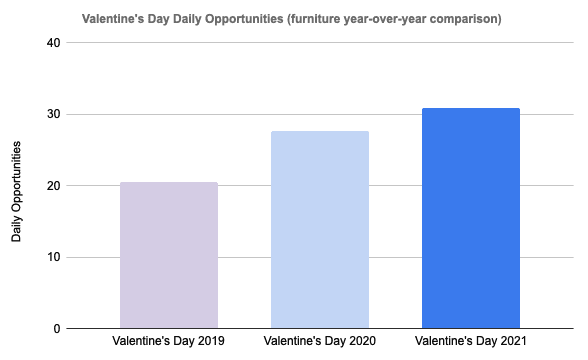
Daily Opportunities up 12%: Daily opportunities are the total shoppers who visit your store. When you thought your significant other was buying flowers, they may in fact have been looking at furniture. Foot traffic was up 12% on Valentine’s day 2020 and was up 35% the previous year.
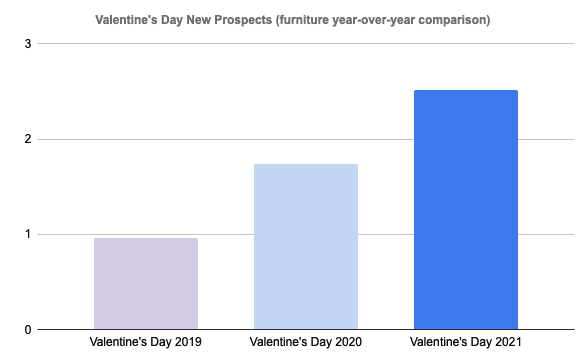
New Prospects up 45%: As we’ve said in the past, new prospects are people who left the store without buying. Unfortunately, we’ve seen 45% more customers leave the store without buying in comparison to last Valentine’s day and 80% more since Valentine’s day 2019.
TRY DOORCOUNTS 3.0 90 DAYS FREE!
…and cure YOUR traffic blindness!
Get your 90-day free trial today and start turning your foot traffic into more sales, with no obligation. And if you already have Doorcounts, get an upgrade.
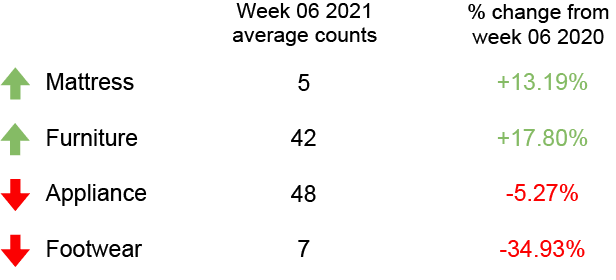
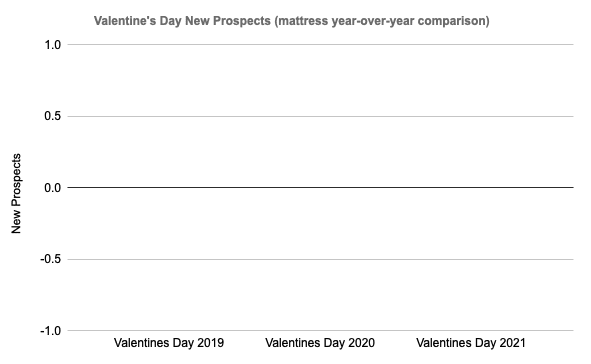
Valentine’s day key metrics (mattress industry)
The mattress industry may need to declare Valentine’s day as one of their biggest sales days of the year after looking at these metrics.
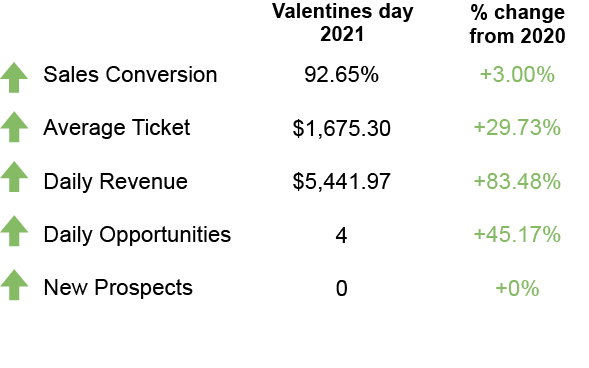
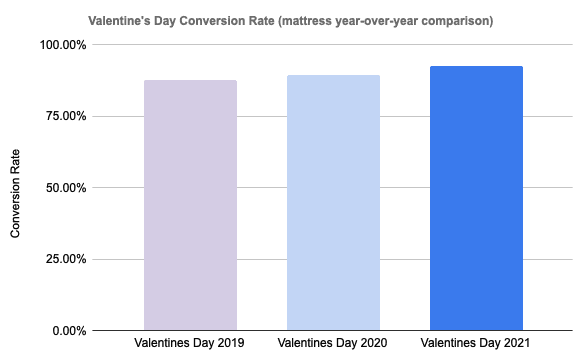
Conversion rate up 3%: Yes. You are seeing that right. The mattress industry had a conversion rate of 93% this Valentine’s day and was only up 3% from last Valentine’s day. When you compare Valentine’s day 2019 to 2020, you still only see a 2% increase. Valentines day = new mattress day
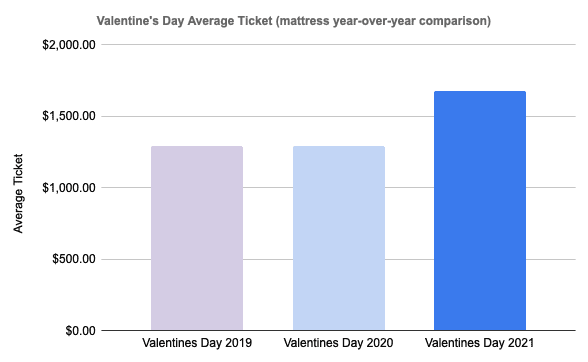
Average Ticket up 30%: In 2020, Valentine’s day saw a 1% decrease from 2019. This year Valentine’s day is back in full effect and resulted in a 30% increase in average ticket.
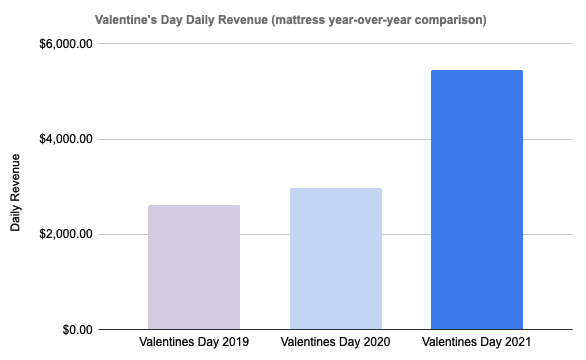
Daily Revenue up 83%: An increase of any other sales or performance metric is great, but the bottom line is normally how much money is being made. On Valentine’s day, the mattress industry saw an increase of 13% in 2020 and an 83% increase in 2021.
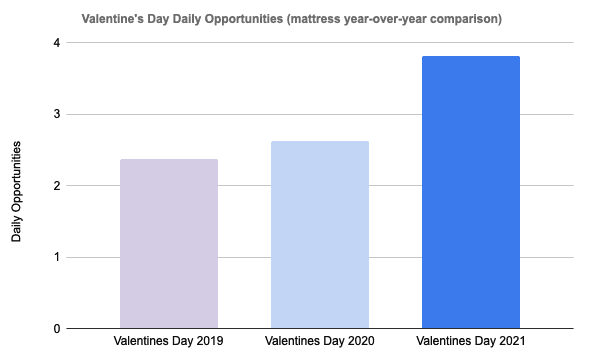
Daily Opportunities up 45%: Although people normally are in a panic to get presents on Valentine’s day, people made time for mattress stores this year. Daily opportunities on Valentine’s day saw an 11% increase in 2020, followed by a 45% increase this year.
New Prospects up 0%: As we’ve said, new prospects are customers who left the store without buying. In the last three years, there have been 0% new prospects on Valentine’s day.
NOTEWORTHY NEWS
RANDOM IRRELEVANCE