
WHAT’S IN THIS WEEKS EDITION, YOU ASK?
- See how the furniture metrics have changed since last March
- How the mattress industry has adapted to the ever-changing world of e-commerce
- How consumer behavior has changed -and is not going back
- Turn your foot traffic into more sales with a 90-day free trial of Doorcounts 3.0.
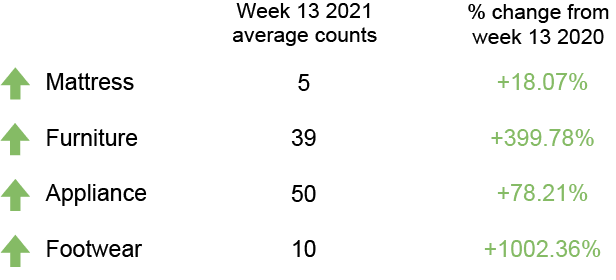
FOOT TRAFFIC INDEX
Here’s a look at last week’s foot traffic compared to the same time last year.
DC FEATURE OF THE WEEK
This is where each week we highlight a feature within Doorcounts. This week’s feature is:

FOOT TRAFFIC TRENDS
Industry insights so you can convert your foot traffic into more sales.
March furniture metrics
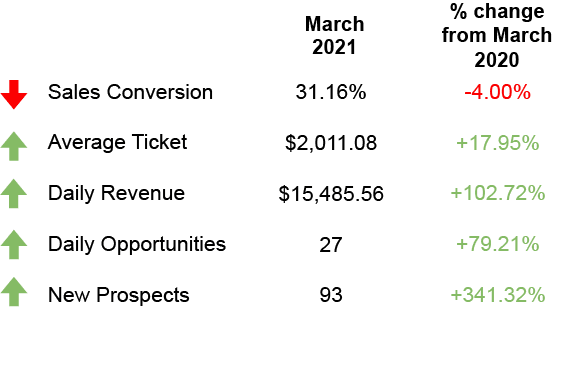
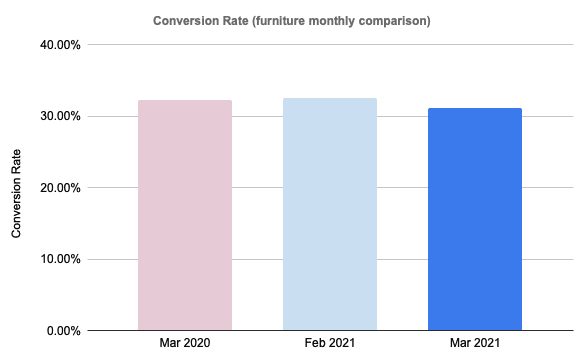
Conversion rate down 4%: Although some metrics are returning to normal, conversion rate is down 4% from March 2020, and also down 4% from last month.
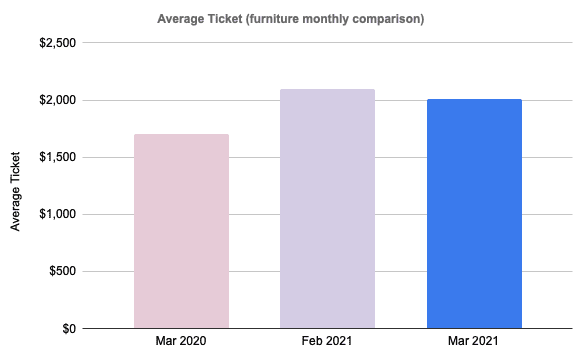
Average Ticket up 18%: Average ticket has stayed strong with an 18% increase year-over-year, while seeing a small decrease of 4% compared to February 2021.
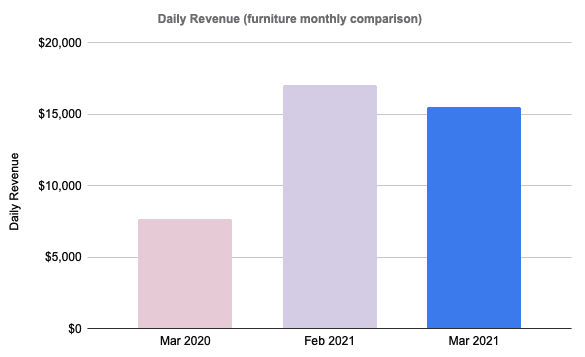
Daily Revenue up 103%: Compared to March 2020, which only saw around $7,600 in daily revenue, March 2021 brought in $15,485 in daily revenue with an increase of 103%.
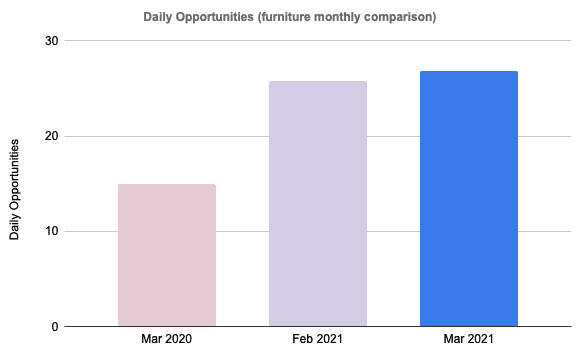
Daily Opportunities up 79%: Daily opportunities are the total shoppers who visit your store. Although sales conversion was down 4%, a 79% increase in foot traffic helped keep daily revenue and average ticket up.
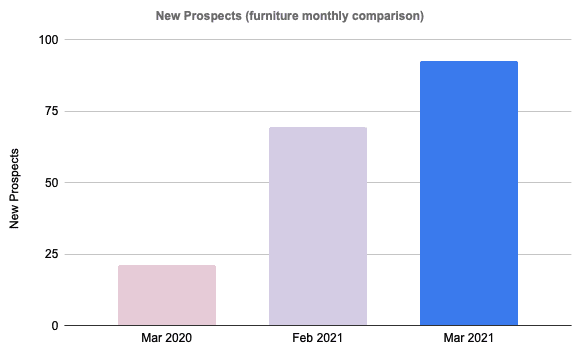
New Prospects up 341%: As we’ve said in the past, new prospects are people who left the store without buying. At one point in the pandemic, people only went to a store unless they were 100% going to buy something. Now, we are back to seeing people leave the store without buying as 341% more people left stores without buying compared to March 2020.
March mattress key metrics
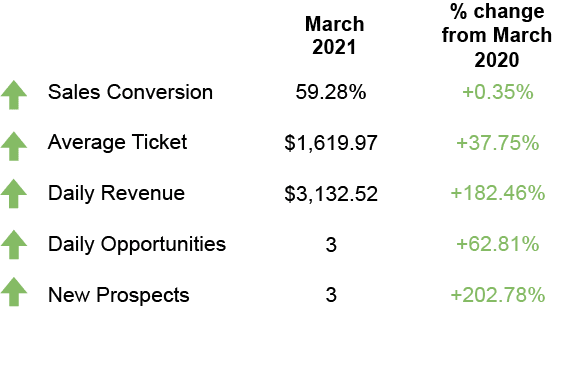
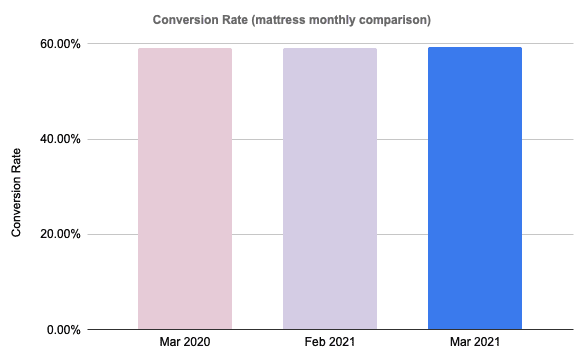
Conversion rate up 1%: Weirdly enough, the mattress industry saw a 0.35% increase since last March, and a 0.37% increase since last month (February 2021). Regardless of all the craziness of the last year, conversion rate hasn’t seen much movement at all.
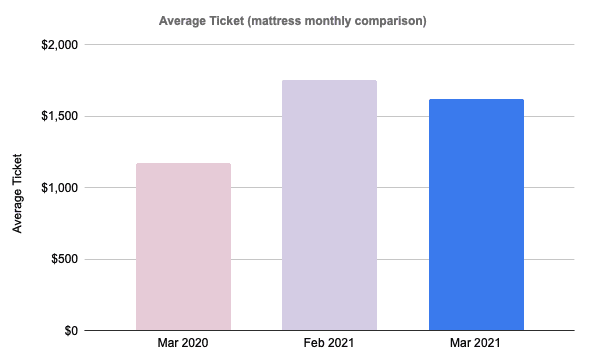
Average Ticket up 38%: Although average ticket increased 38% compared to March 2020, when compared to last month, which had the highest average ticket in over a year, there was an 8% decrease in average ticket.
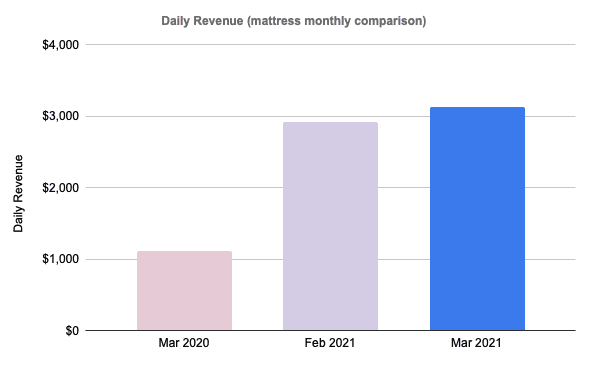
Daily Revenue up 182%: March 2020 was a dark time for retail. Thankfully, a year later daily revenue is up 182% and is up 7% from February 2021. It’s amazing the difference a year can make.
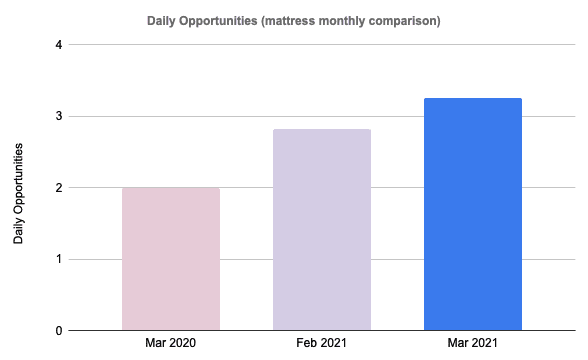
Daily Opportunities up 63%: Almost a year to this day, March 20th to be exact, lockdowns were enacted and people physically could not enter a retail store. In March of 2021, we see foot traffic up 63% year-over-year and also up 15% from February 2021.
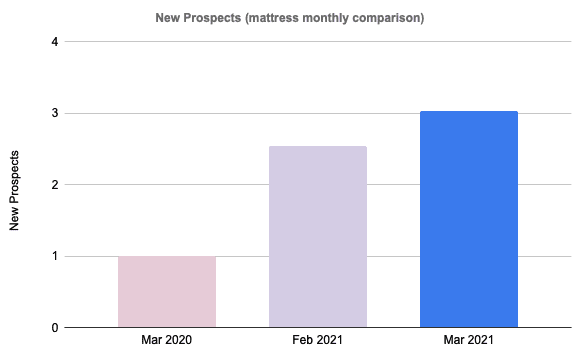
New Prospects up 203%: As we’ve said, new prospects are customers who left the store without buying. To put the 205% into perspective, new prospects went from one customer to three customers in the last year. Thankfully, new prospects only saw an increase of 19% increase since February 2020.

NOTEWORTHY NEWS
RANDOM IRRELEVANCE