
Despite a drop in foot traffic, Q3 highlighted retailers’ ability to make more sales out of less traffic.
With a 10% increase in sales conversion year-over-year, and a 22% increase in average ticket, retailers are finding the secret formula to make the most out of every opportunity.
This week we release our Q3 benchmark report and get an inside look at how the top 20% of stores are performing at the highest level.
THIS WEEK’S HIGHLIGHTS
- Q3 home furnishing and mattress benchmark report.
- Trends that are expected to change the retail landscape in 2022.
- Why consumers are already starting their holiday shopping.
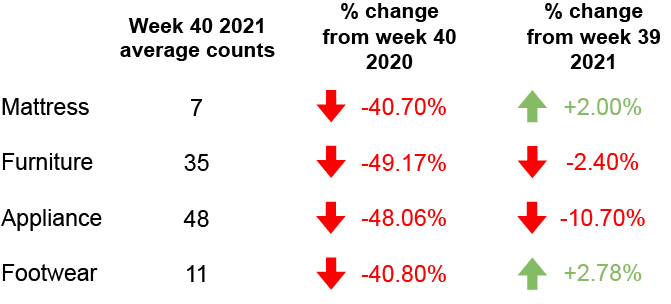
FOOT TRAFFIC INDEX
Here’s a look at last week’s foot traffic compared to the same time last year.

FOOT TRAFFIC TRENDS
Industry insights so you can convert your foot traffic into more sales.
Furniture Q3 2021
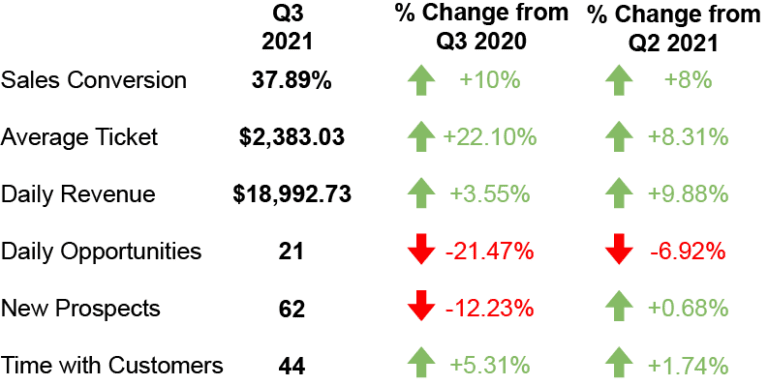
As the summer heat waves come to an end, the average daily traffic per store decreased 21% year-over-year from 27.6 in 2020 to 21.7 in Q3 of 2021. In comparison to Q2 2021, foot traffic is down 7%.
Salespeople made the most out of the lack of foot traffic and converted 38% of their opportunities into sales. Q3 2021 average conversion rate was up 10% year-over-year, with September having the highest conversion rate year-to-date.
The average ticket in Q3 is where we see a major improvement from 2020. Q3 average revenue per transaction was $2,383, up 22% from 2020 which had an average ticket of $1,951. In comparison to Q2 2021, the average ticket has increased by 8%.
Despite a significant drop in foot traffic, average daily revenue for Q3 increased 3.5% for an average of $18,992 in Q3 2021. Although there was only a $100 difference between July 2020 and 2021, August and September is where sales started to see an uptick.
As we all know, it takes time to build a relationship with a potential customer. The average time spent with customers was 44 minutes in 2021, up 5% from Q3 2020.
Download the full report to see an in-depth look at Q3 2021.
Mattress Q3 2021
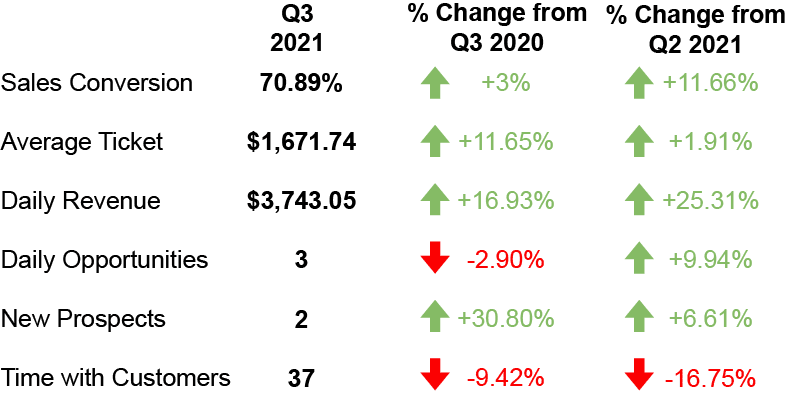
Q3 2021 average daily traffic per store decreased 2.9% year-over-year to 3.24 visitors per day. Unlike 2020, August 2021 did not see an increase in foot traffic that we saw in previous years.
Salespeople in the mattress industry converted an average of 70.9% of the people who walked into their stores into sales. this is up 3% from Q3 2020 and an 11.6% increase from Q2 2021
Average revenue per transaction was $1,671.74. This is up 11.65% from 2020, which had an average ticket of $1,497.33. September 2021 saw an increase of 4% from the previous yearly high of $1,770 in May of this year.
With the help of salespeople increasing the average ticket, average daily revenue per store rose 16.9% from $3,201 in 2020 to $3,743 in Q3 of 2021. July 2021 had the highest daily revenue thus far this year with an average daily revenue of $3,820.
Download the full Benchmark report HERE.
The Fam
TO BE UPDATED
NOTEWORTHY NEWS
Plan B: What Americans who can’t find a new couch are resorting to.
Report: The majority of consumers plan to shop early this year.
2022 trends: Smart shopping carts and headless tech toolsare top of mind for retailers looking to get out from under the supply-chain mess.
Holiday predictions: Does the September retail uptick hint at smooth holiday sales?
RANDOM IRRELEVANCE
1 in 100 billion.: A Meteorite fell onto a woman’s bedwhile she was sleeping.
AI is saving lives: How artificial intelligence is helping to make breast cancer history.
Squid Game: Netflix values its mega-hit show Squid Game at $900m after reaching #1 in over 90 countries.
The forgotten theory: Can Einstein’s forgotten theory of space solve the cosmology crisis?