
As we begin the 19th week of 2021, it’s time to sit back and see how the furniture and mattress industries compared to April 2020.
Although April 2020 was a time none of us want to go back to, the data lets us see how much the retail industry has changed in one year.
From a time where there was little to no traffic, to a month where every metric is trending positively.
WHAT’S IN THIS WEEKS EDITION, YOU ASK?
- See how the furniture industry has changed since last April
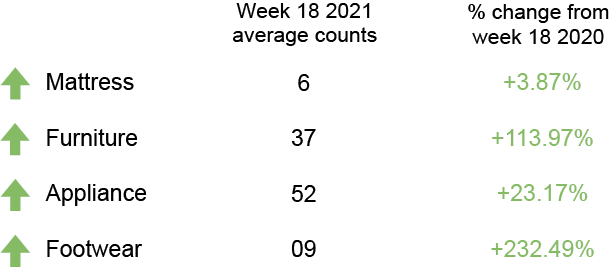
- How the mattress industry saw a 1232% increase in daily revenue
- How and why consumer data platforms are becoming essential.
- Join our performance data workshop today at 1 pm EST.
FOOT TRAFFIC INDEX
Here’s a look at last week’s foot traffic compared to the same time last year.
DC FEATURE OF THE WEEK
This is where each week we highlight a feature within Doorcounts. This week’s feature is:
A second click lets them record the outcome with a: sale, no sale, or potential sale.
Lastly, A third click lets you see key performance metrics (KPM) by the minute, from anywhere, on any device.

FOOT TRAFFIC TRENDS
Industry insights so you can convert your foot traffic into more sales.
April furniture key metrics
No matter how things are going in your store this year, it’s always a good idea to look back at the same time last year to see how you stack up.
The furniture industry is living in a completely different world compared to last April with every single metric seeing an increase year-over-year.
Not only that, but all of the metrics also saw an increase compared to March 2021.
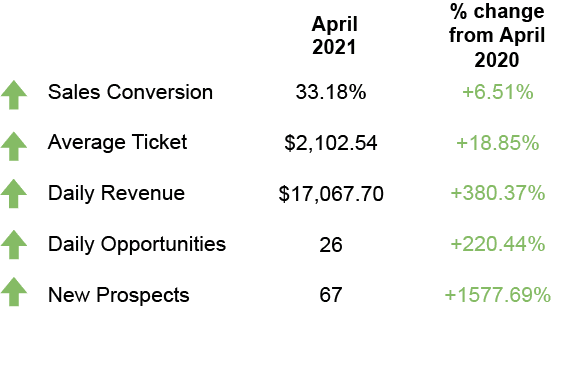
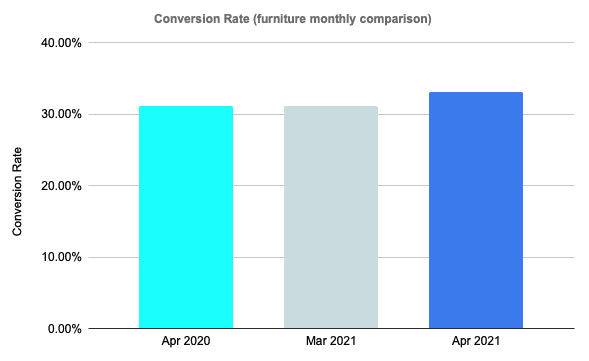
Conversion rate up 7%: Compared to last April when it was nearly impossible to convert a sale, sales conversion is up 7% this April.
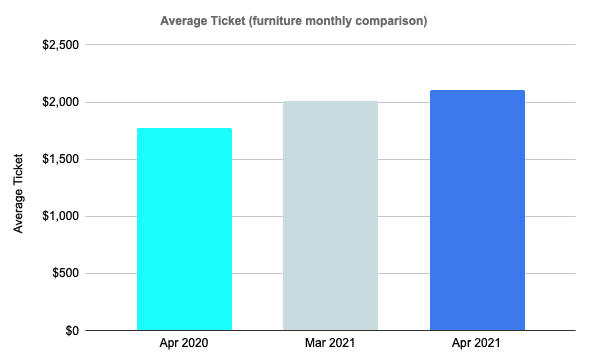
Average Ticket up 19%: Average ticket has stayed strong with a 19% increase year-over-year, while seeing a small increase of 5% compared to March 2021.
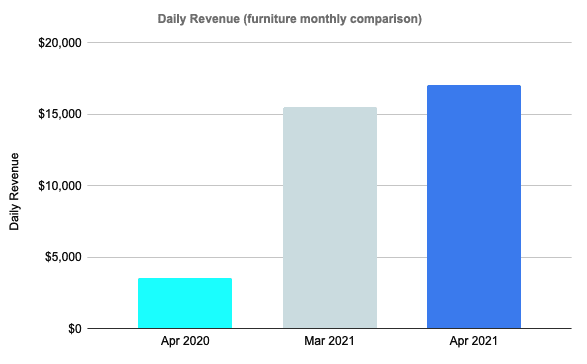
Daily Revenue up 380%: Last April in the height of lockdowns, the furniture industry saw a daily revenue of only $3,553. Now a year later, daily revenue saw a 380% increase to $17,067. As we’ve learned, a lot can happen in a year.
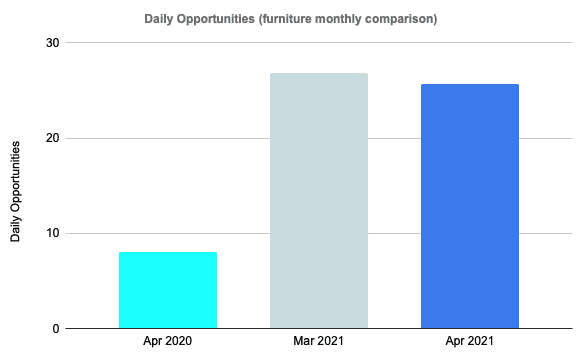
Daily Opportunities up 220%: Daily opportunities are the total shoppers who visit your store. While last April only saw an average of 8 customers a day, this April we saw 26, an increase of 220%. Although we see an increase year-over-year, foot traffic was down 5% compared to the previous month.
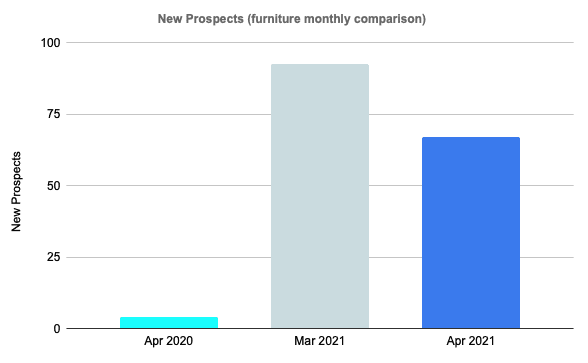
New Prospects up 1577%: As we’ve said in the past, new prospects are people who left the store without buying. At one point in the pandemic, people only went to a store unless they were certain they were going to buy something. Now, a 1577% increase in new prospects shows us that more and more people go to stores just to look around. – Which is a plus in our eyes.
THE FAM X DOORCOUNTS
Using data gathered from Doorcounts, The FAM uncovers ways to squeeze more sales out of Presidents Day.
Although deals and sales campaigns usually lead up to Presidents Day, the data reveals the importance of continuing sales the week after the holiday.

April mattress key metrics
Similar to the furniture industry, the mattress industry saw major improvement compared to the same time last year.
The mattress industry in April 2021 saw the biggest year-over-year increase that we have reported on thus far in Retail Traffic Trends.
Customers are slowly beginning to normalize going back to stores and we have started to see more and more traffic in the mattress industry.
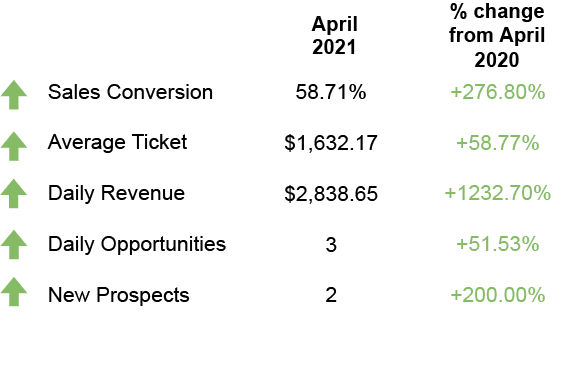
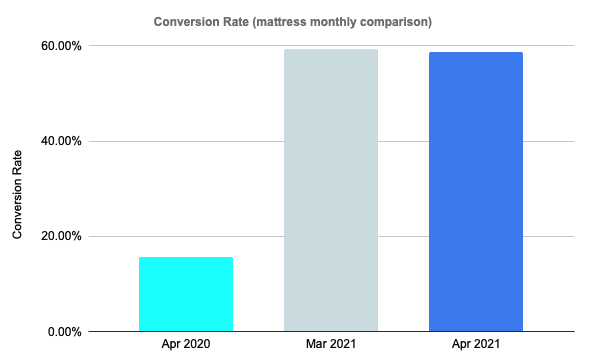
Conversion rate up 277%: You read that correctly. Sales conversion is night and day compared to the 15.58% sales conversion seen during the lockdowns of last April. April 2021 saw a conversion rate of 58.71%, which is a 277% increase from last April and a 0.98% decrease compared to the previous month.
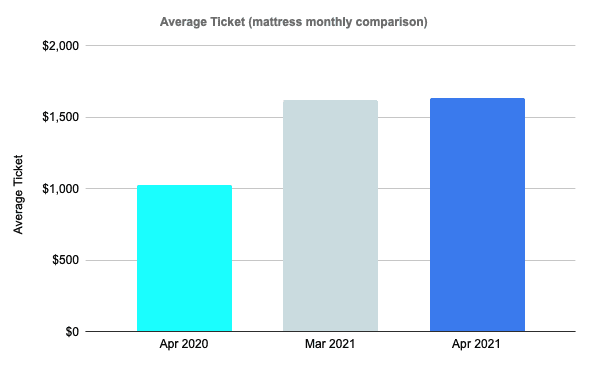
Average Ticket up 59%: Average ticket went from $1,028 in April 2020 to $1,632 in April 2021. This year, average ticket has stayed relatively consistent with a slight increase of 0.75% compared to March 2021.
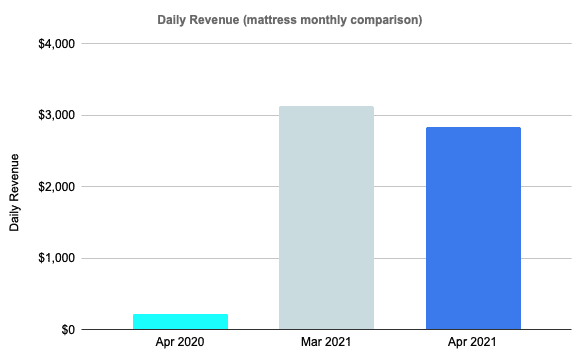
Daily Revenue up 1233%: As we are all well aware, April 2021 was a less than an ideal month for sales. Compared to last April, which saw an average daily revenue of only $213, April 2021 saw a 1233% increase to a daily revenue of $2,838. Although this a big jump compared to last month, the mattress industry saw a 9.38% decrease from the previous month.
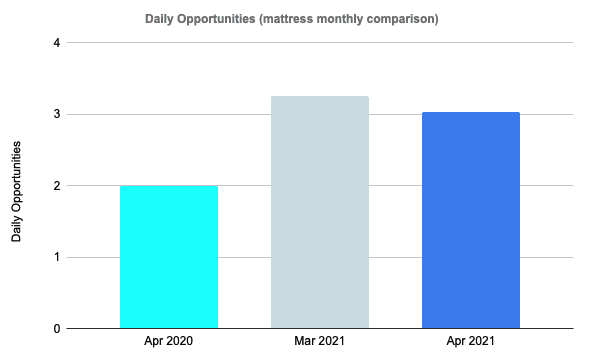
Daily Opportunities up 52%: While we do see a 52% increase in foot traffic year-over-year, foot traffic still is not fully back to normal. Foot traffic in April 2021 was down 7% compared to March 2021.
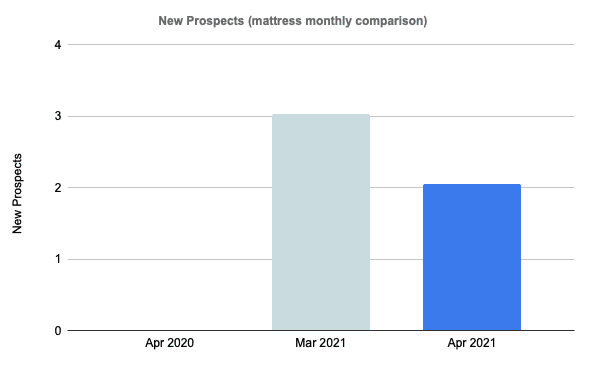
New Prospects up 200%: As we’ve said, new prospects are customers who left the store without buying. To put the 203% into perspective, new prospects went from one customer to three customers in the last year. Thankfully, new prospects saw a 32% decrease since March 2021.
NOTEWORTHY NEWS
RANDOM IRRELEVANCE