WHAT’S IN THIS WEEKS EDITION, YOU ASK?
- See how the furniture industry has changed since last May.
- How the mattress industry increased average ticket by 42%.
- The different ways motivation and accountability play a vital role on your sales team.
- The return of the handshake in business.
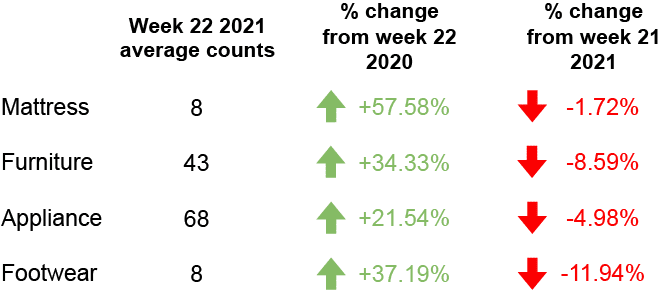
FOOT TRAFFIC INDEX
Here’s a look at last week’s foot traffic compared to the same time last year.
DC FEATURE OF THE WEEK
This is where each week we highlight a feature within Doorcounts. This week’s feature is:
To see exactly where the excludes are coming from, the charts filter by Exclude reason, location, salesperson, and by time threshold

FOOT TRAFFIC TRENDS
Industry insights so you can convert your foot traffic into more sales.
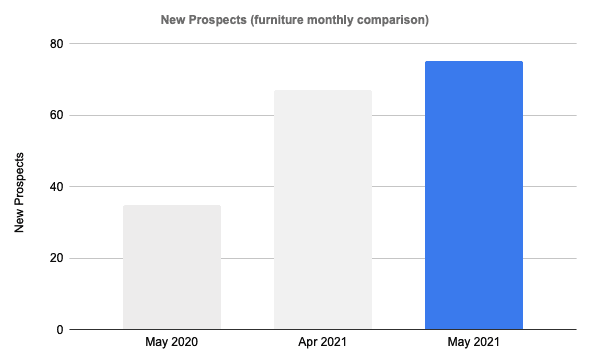
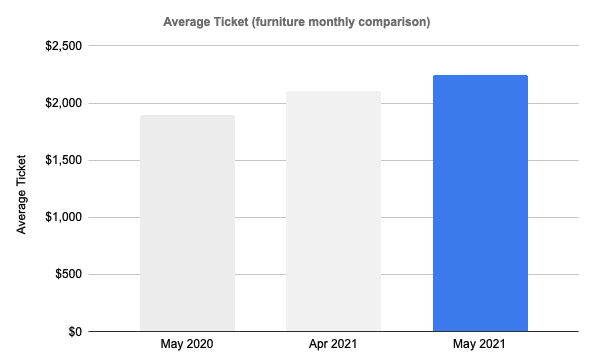
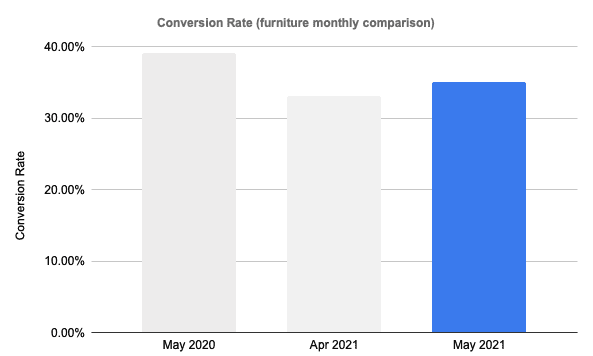
Furniture industry on top in May

The furniture industry made major strides compared to May 2020, which is quite the achievement given that May 2020 was the best month for furniture last year.
When shoppers went to stores in May of last year, there was a much higher likelihood they would buy due to the risks involved with shopping at the time. That being said, a 10% decrease in sales conversion is a minor setback to an otherwise great month.
Customers are starting to spend more of their excess savings on each shopping trip as we see not only an 18% increase in average ticket since May 2020 but also a 7% increase since April 2021.
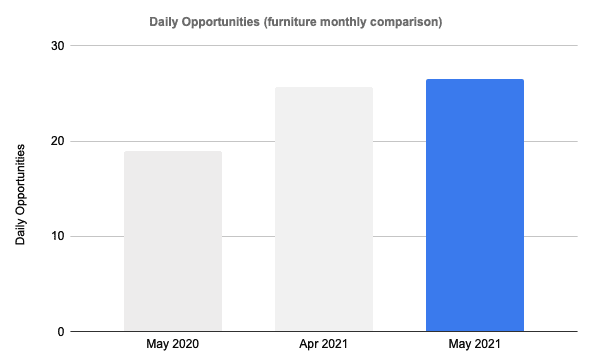
Although the conversion rate was lower than it was at the same time last year, an increase in foot traffic to 27 customers a day greatly helped the bottom line for sales.
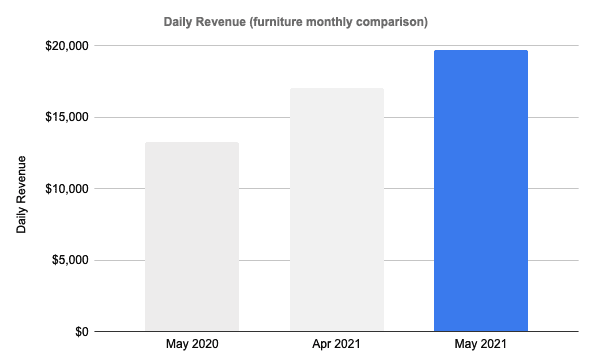
For the first time since we’ve released this newsletter, the furniture industry is closing in on $20,000 in average daily revenue. In comparison, May 2020 had an average daily revenue of $13,300.
Overall, the data from May 2021 would make you assume that the world is fully back to normal, which more than anything shows the need to compare data to what is happening in the world at that time.
SEE FULL COLLECTION OF CHARTS BELOW

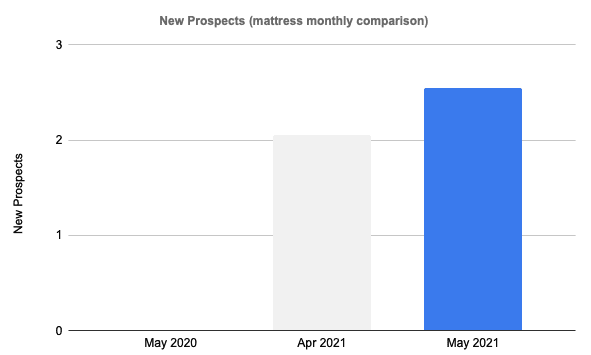
Mattress industry leaves May in the dust
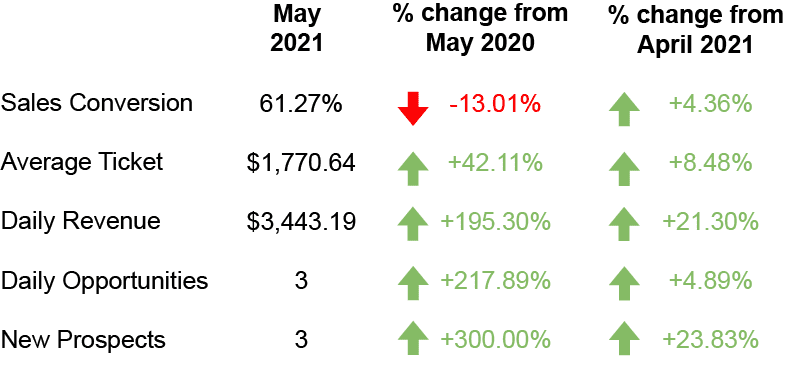
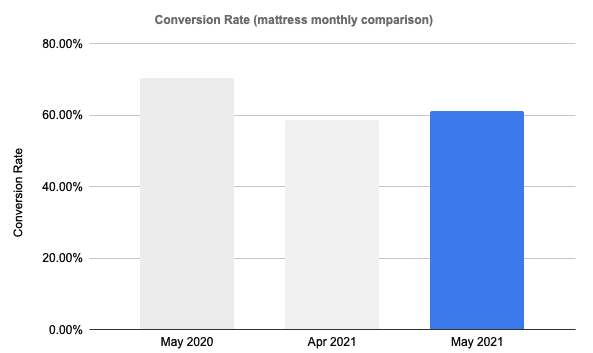
Similar to the furniture industry, the mattress industry is in the green for every metric besides sales conversion compared to May 2020.
Simply put, converting sales was much easier when a majority of people were shopping to shop, rather than to browse.
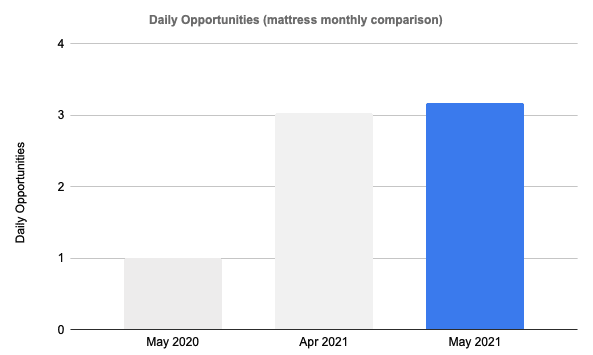
As we all know, most metrics will fall into line if foot traffic stays steady. Compared to May 2020, Foot traffic is up 217% in May 2021. Obviously, the percentages are a little deceiving when we are talking about 2 or 3 customers a day.
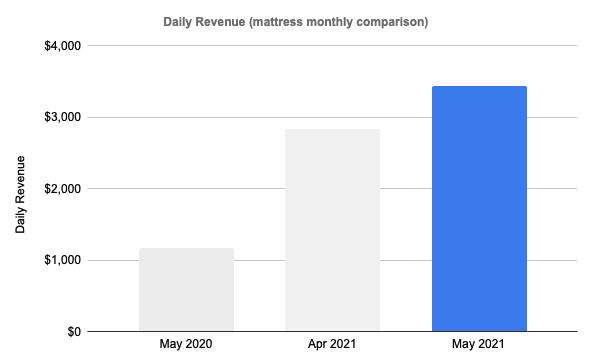
Although sales were converted at a higher rate in May 2021, an increase in both foot traffic and average ticket resulted in a daily revenue increase of 195% year-over-year. On top of that, daily revenue is up 21% from April 2021, which had the highest daily revenue this year up until May.
Shoppers are not just going to stores more frequently, but they are spending more money during each purchase. This is a trend that has continued throughout 2021.
Throughout 2021 we are not only seeing year-over-year increases in the mattress industry, but also month-by-month increases.