November 8, 2023
Retail Traffic Trends #153: October Metrics are in!
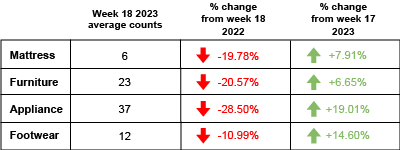
This October, the furniture and mattress industry saw significant increases in their prospects gathered compared to the previous month.
This week we will take a closer look at what drove these improvements in the industry and what they could mean for the future.
THIS WEEK’S HIGHLIGHTS
- October recap: Everything you need to know about how last month played out.
- Trakwell.ai v23.4: Learn more about our latest Trakwell.ai update.
- Q2 2023 Benchmark Report: Click HERE to download the report.

FOOT TRAFFIC TRENDS
Industry insights so you can convert your foot traffic into more sales.
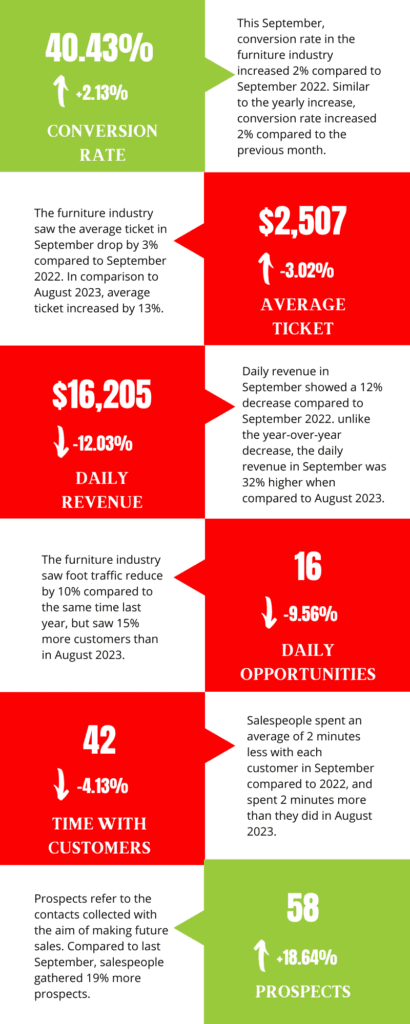
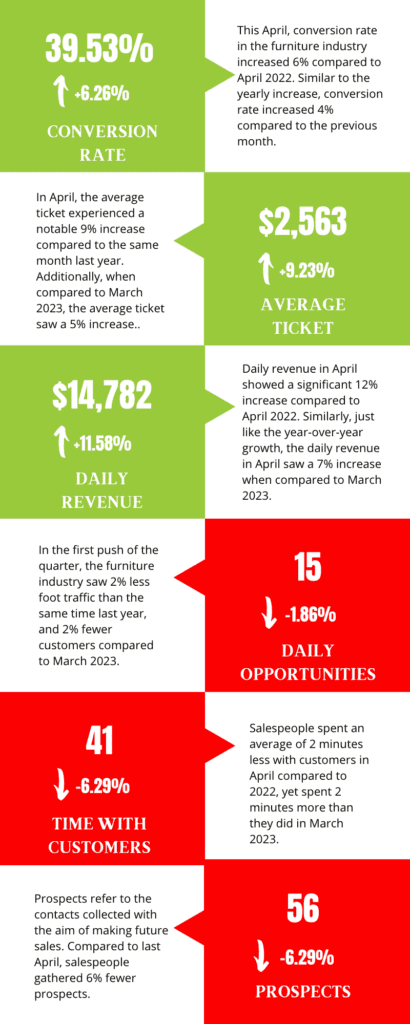
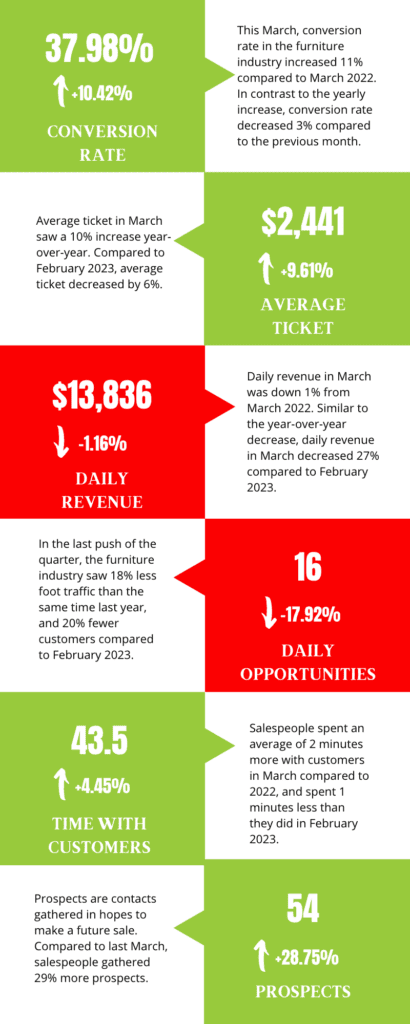
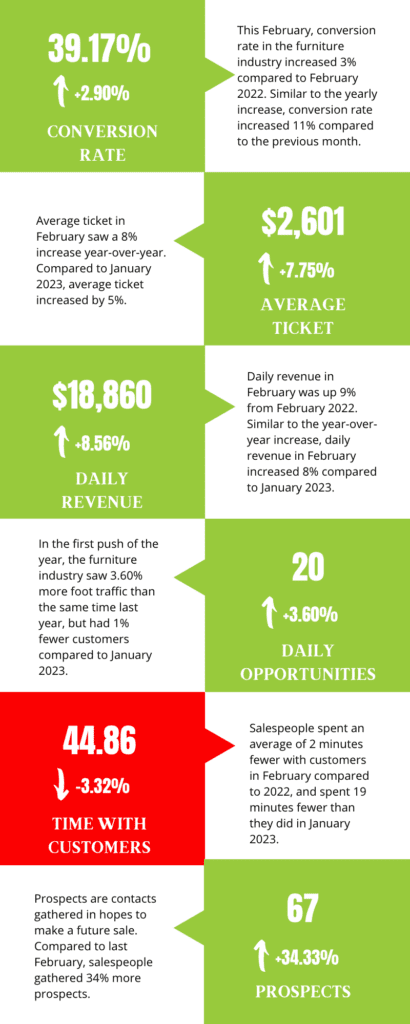
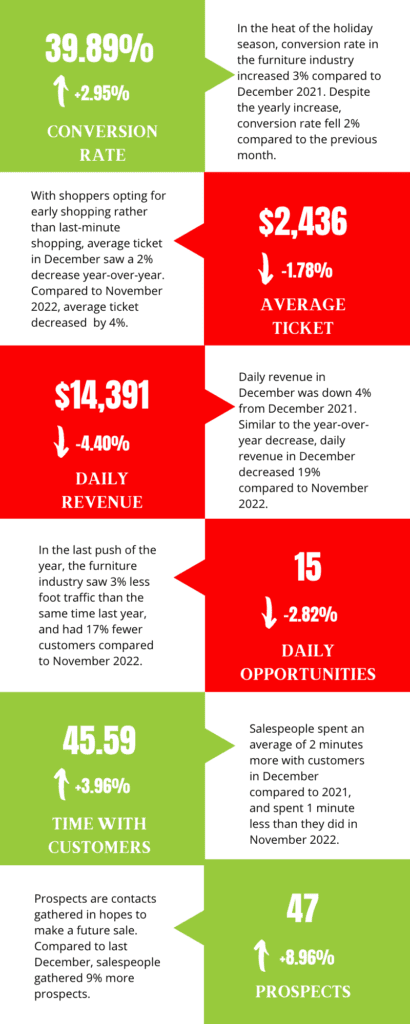
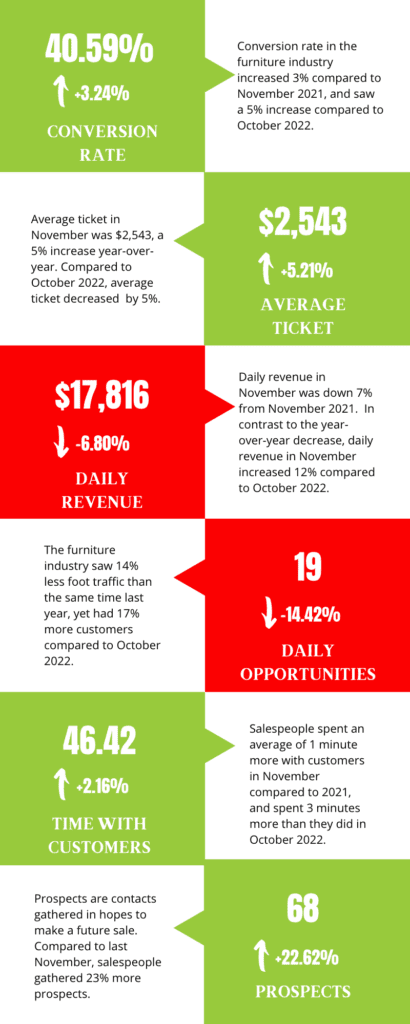
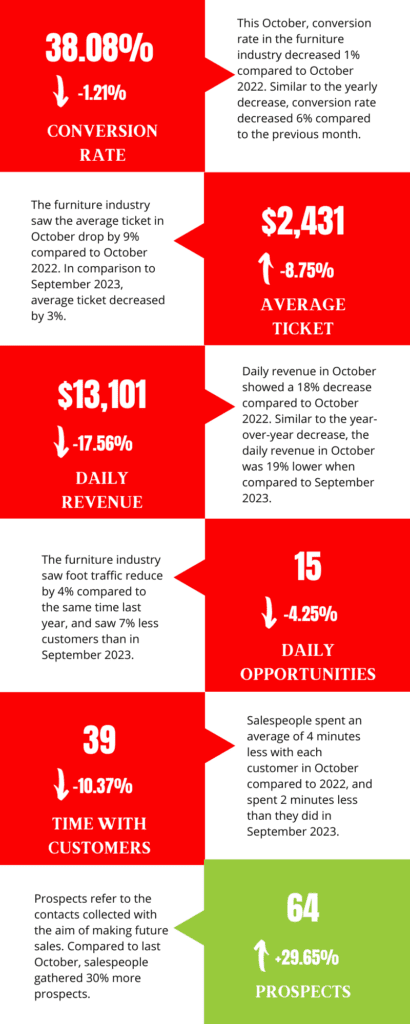
October 2023: Furniture industry
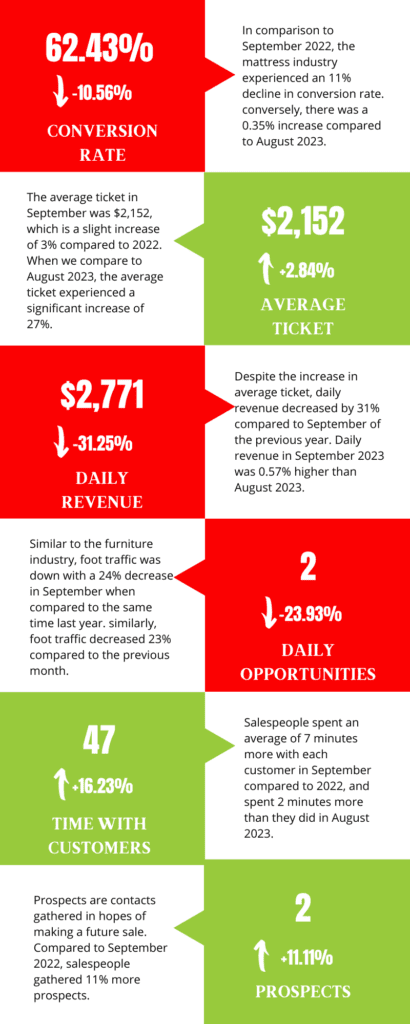
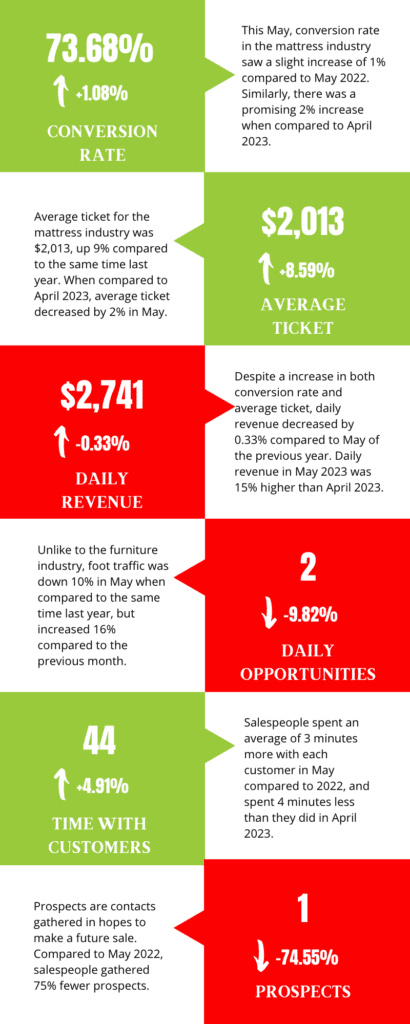
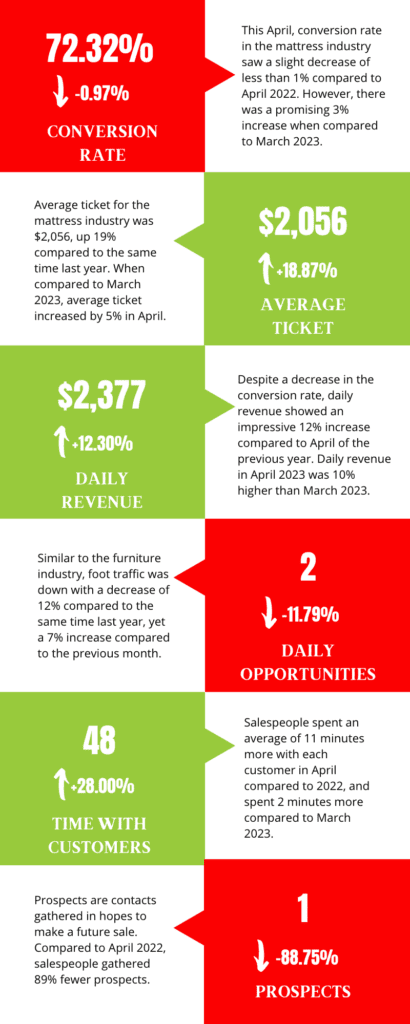
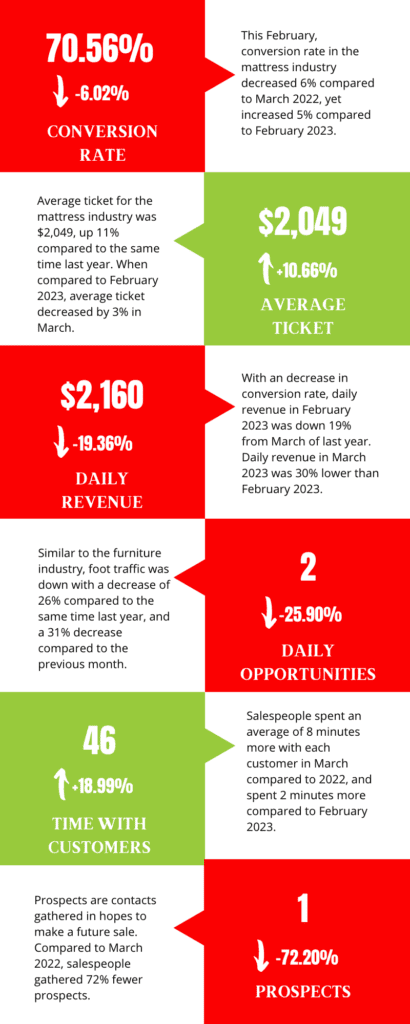
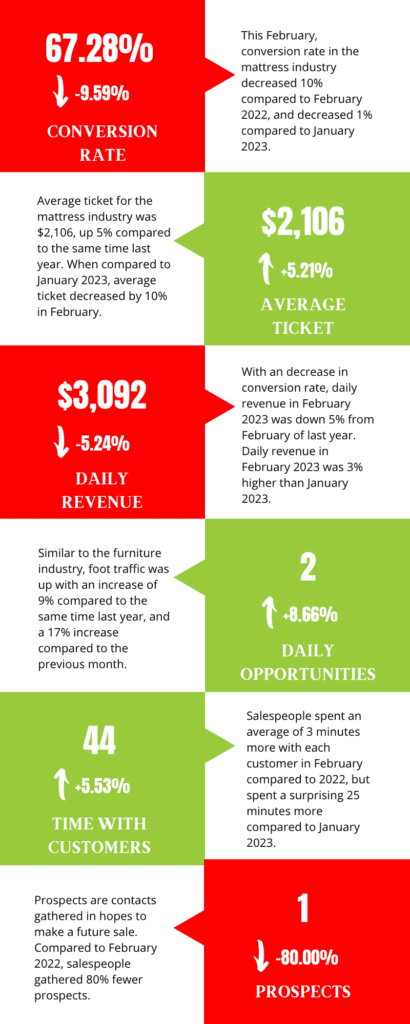
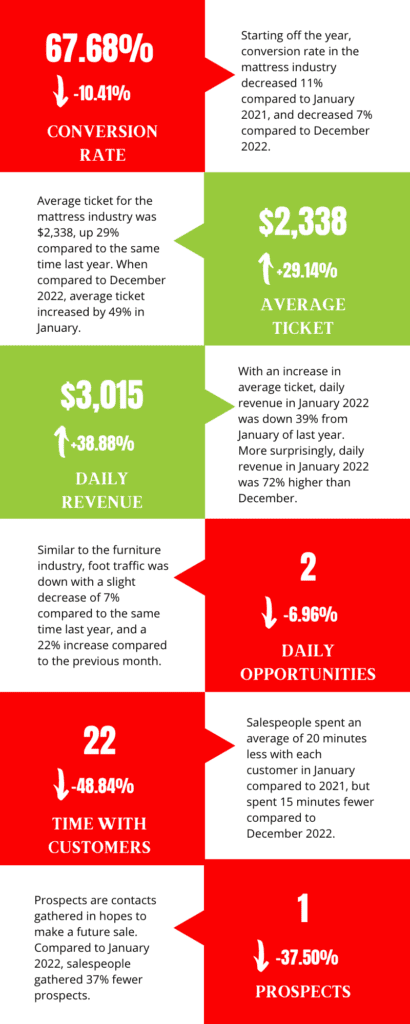
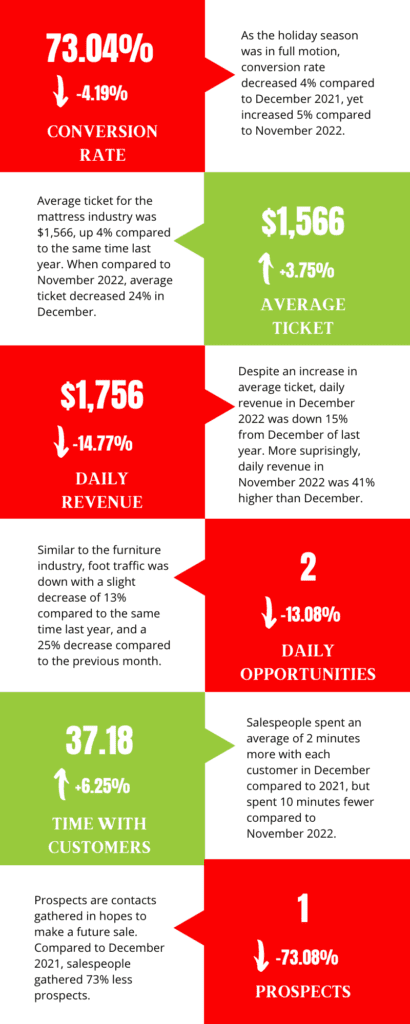
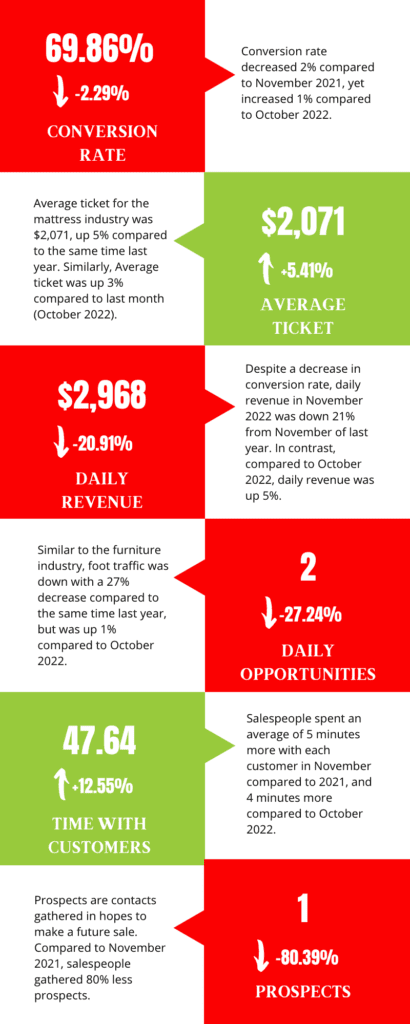
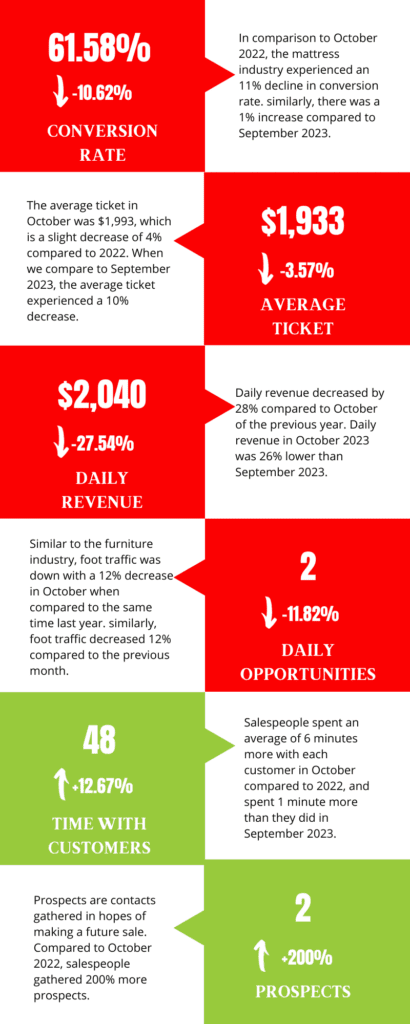
October 2023: Mattress industry
Retail Snippets
By the numbers: Uncovering the digital ad spending by industry in 2023.
Targeted marketing: For the retail industry, generative AI means more targeted marketing.
The slow burn: Top challenges faced by emerging brands in 2023.
RANDOM IRRELEVANCE
New Beginnings: Footwear brand Sorel is opening its first pop-up shop this Friday.
Look up: Watch live as NASA reveals what’s inside the asteroid sample canister.
Instant Supplement: GNC piloting drone delivery service in select U.S. markets.