December 6, 2021
Retail Traffic Trends #55: November by the metrics
November data is in, and the numbers will not disappoint.
Compared to November 2020, the furniture, mattress, and footwear industry saw significant increases in nearly every performance metric.
Despite an overall drop in foot traffic, salespeople have turned a month of lackluster foot traffic into one of the most impressive months of sales thus far.
THIS WEEK’S HIGHLIGHTS
- Mattress and furniture industry: The importance of spending an extra 3 minutes with customers.
- Footwear industry: The biggest increase in average ticket we’ve seen thus far.
- Cyber Monday: Sales edge down to $10.7B as consumers make a dent in their holiday shopping.
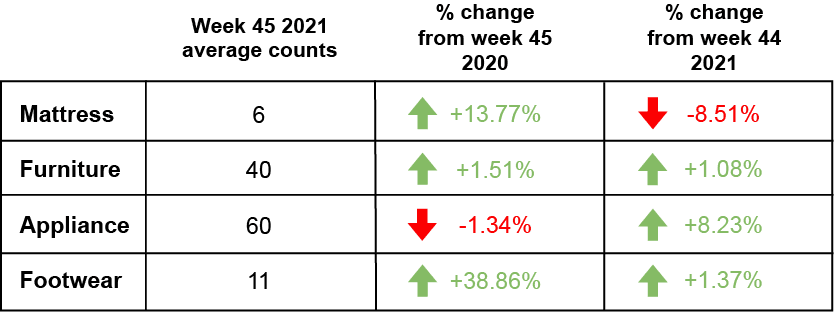
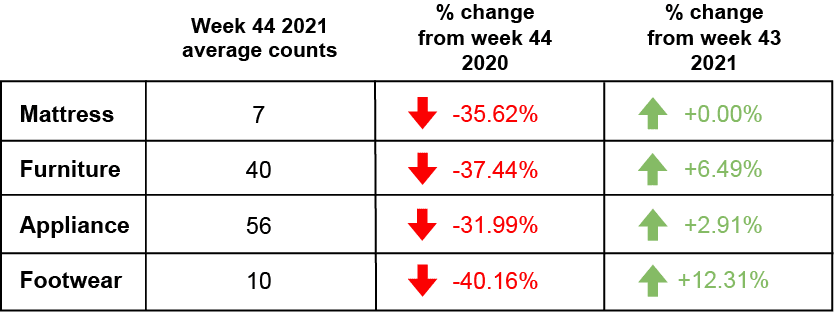
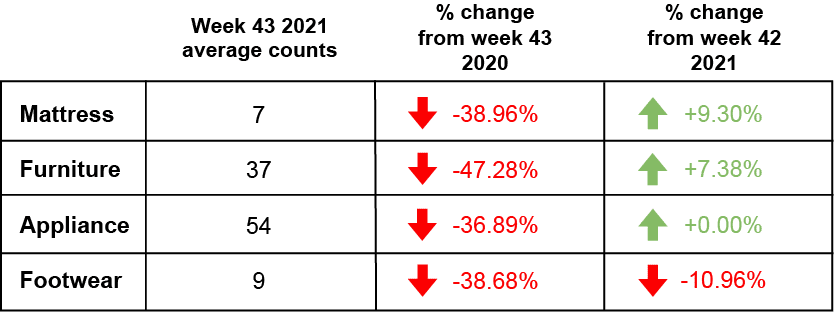
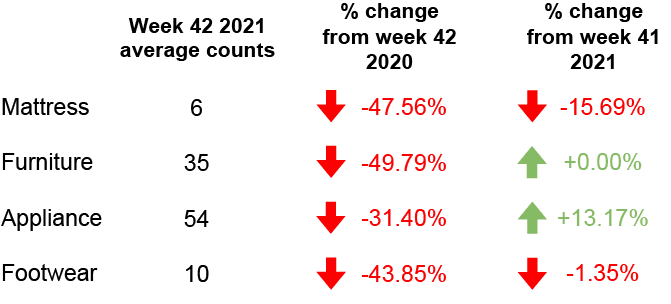
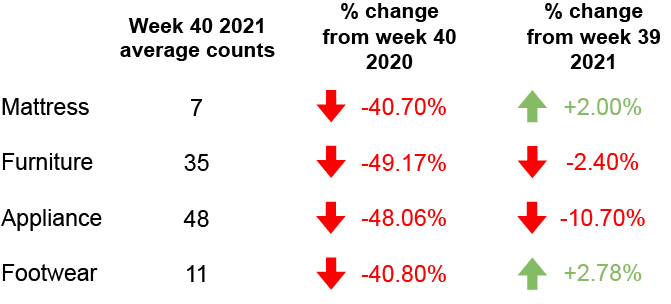
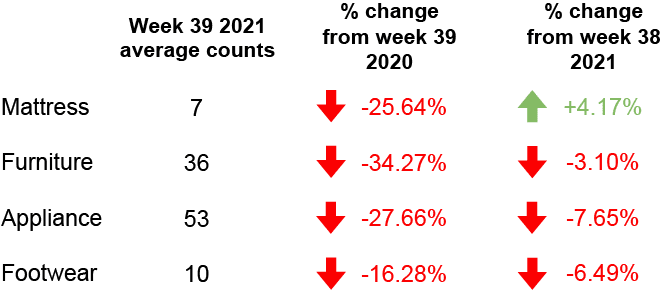
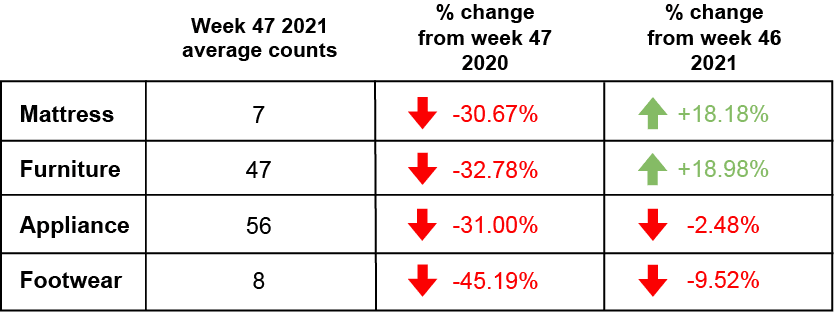
FOOT TRAFFIC INDEX
Here’s a look at last week’s foot traffic compared to the same time last year.

FOOT TRAFFIC TRENDS
Industry insights so you can convert your foot traffic into more sales.
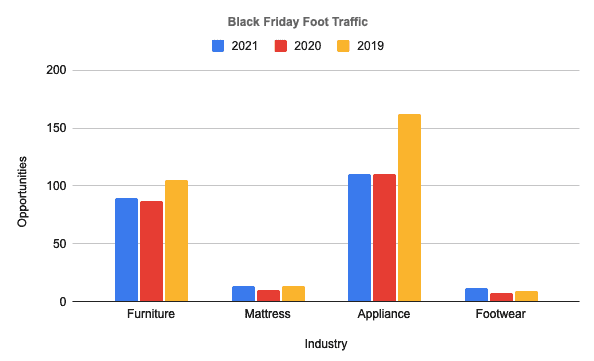
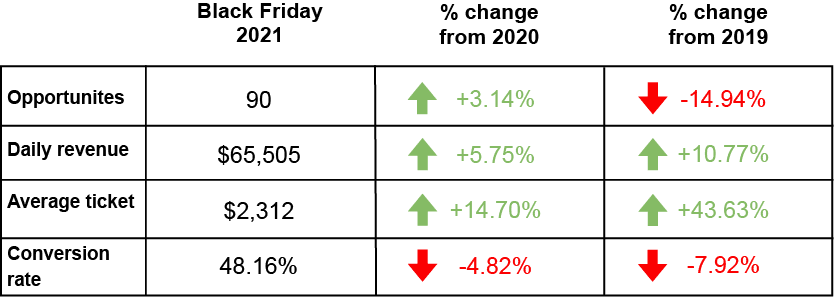
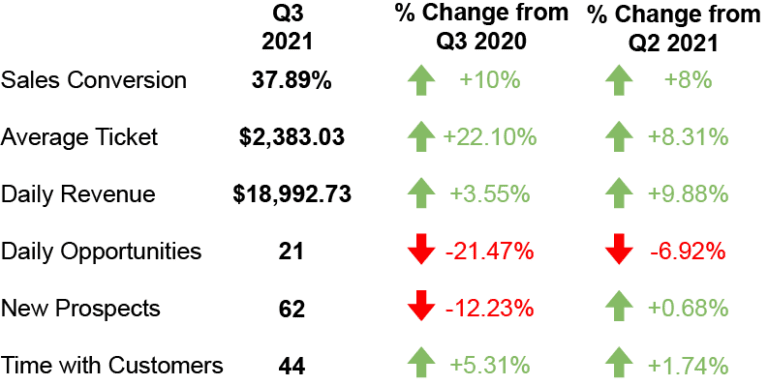
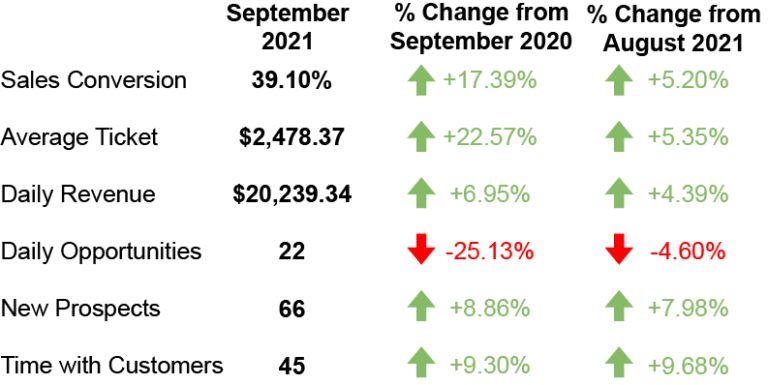
The furniture industry takes November by storm
In November, the furniture industry overcame lower foot traffic than November 2020 and increased nearly every metric.
Compared to November 2020, foot traffic was down 20% from an average of 27 customers last year to 22 this year. Compared to last month, foot traffic stayed consistent with an average of 22 opportunities in both October and November 2021.
With Black Friday and the holiday season resulting in people shopping with more intent rather than browsing, the conversion rate increased 19% year-over-year and increased 6% compared to October 2021.
In addition to an increase in conversion, those people who did buy ended up spending more on average than they have in years past. The average ticket in the furniture industry increased from $2,078 in November 2020 to $2,417 in 2021, a 16% increase. The increase in both conversion rate and average ticket resulted in daily revenue seeing a 4% increase year-over-year.
When it came to spending an adequate amount of time with customers, salespeople in the furniture industry spent an average of 3 extra minutes with each customer.
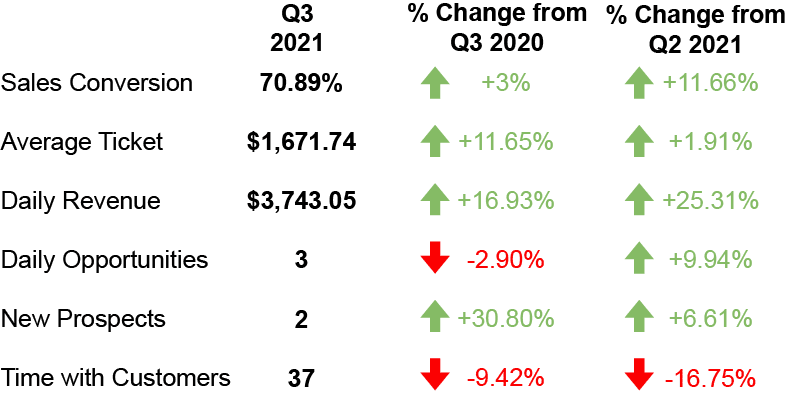
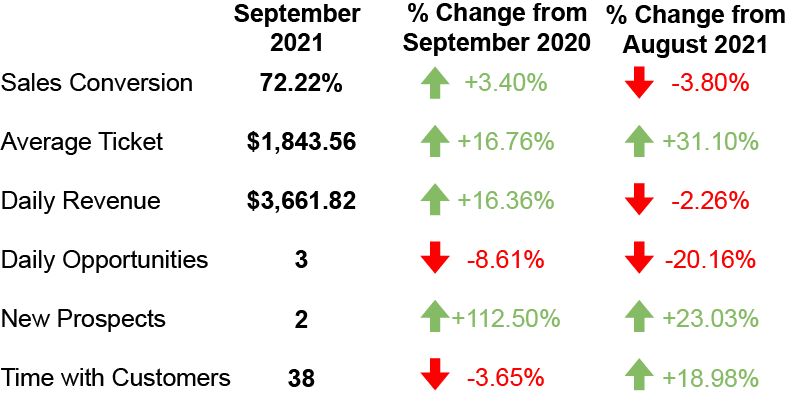
Mattress sales in November
Similar to the furniture industry, every metric was in the green in November, except for foot traffic. Foot traffic in the mattress industry was down 7% compared to November 2020, but up 22% compared to October 2021.
The biggest improvement since November 2020 was daily revenue increasing a staggering 40% from $2,685 in 2020 to $3,753.71 in 2021. This increase is in part due to a significant increase in both conversion rate and average ticket.
In November 2020, salespeople in the mattress industry converted 59% of their opportunities into sales. This November, that number increased to 71.5%. That level of increase alone would be enough to increase daily revenue, but with the additional increase in average ticket, we start to see where the magic happened.
Average ticket increased by 20.29% from $1,633 in November 2020, to $1,965.00 in November 2021. In comparison to the previous month, October 2021, which had an average ticket of $1,815.80, the average ticket increased 8.22%.
As we have seen in previous months, salespeople have found a way to make the most out of fewer opportunities and turn a lackluster month of foot traffic into a month of positive metrics.
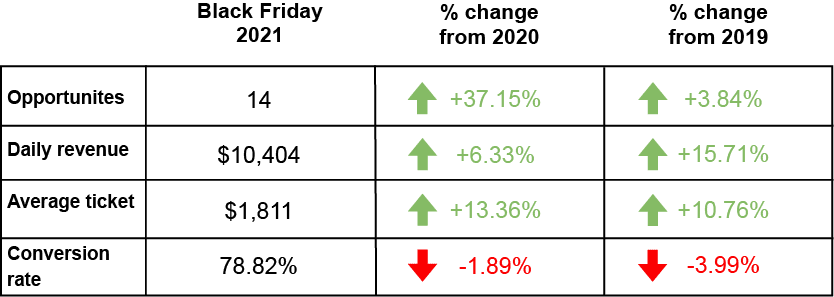
November in the footwear industry
While we always give commentary on foot traffic for the footwear industry, this month is the first month we dive deep into the performance metrics of the footwear industry.
Despite other industries seeing lower foot traffic than the same time last year, the footwear industry saw average foot traffic of 5 customers a day, a 34.83% increase compared to November 2020. This increase may be a result of footwear being more in-line with holiday gifts than the other industries.
The biggest increase of all the industries comes from daily revenue in the footwear industry increasing 67.58% year-over-year from $1,157 in November 2020 to $1,938.30 in November 2021.
Although daily revenue saw a major increase, the increase did not come from converting more sales, but instead by significantly increasing the average ticket. The conversion rate dropped -0.51% year-over-year and by -4.69% compared to October 2021.
The average ticket went from $496 in November 2020, to $589.91 in November 2021. While $589 seems quite high for the footwear industry, a majority of Doorcounts footwear customers are in the specialty shoe and arch support business where their customers buy much more than a regular pair of shoes.
Overall, November was an impressive month for the footwear industry with the most significant increases compared to other industries.
Retail Snippets
Cyber Monday: Sales edge down to $10.7B as consumers make a dent in their holiday shopping.
Holiday sales: Sales on track to blow past record for spending, topping retail trade group’s biggest forecast.
Truth in the data: A look into physical retail’s data distortion trap.
Pay on your own time: Buy now, pay later orders up 34% this holiday.
RANDOM IRRELEVANCE
Banksy: Can pop-up Banksy and Van Gogh shows save retail?
Living the dream: Ever wanted to spend the night in Ikea? In Denmark, a snowstorm means people sleep overnight in an IKEA.
Watch: Here’s what the only total solar eclipse of 2021 was like from a cruise ship near Antarctica.