July 20, 2021
Retail Traffic Trends #35: Retail’s bigger picture
Last week we took a look at the second quarter by sales volume and got a sneak peek into the differences between a small retailer and a global brand.
While taking a deep dive into key performance metrics is our bread and butter at Retail Traffic Trends, sometimes you need to sit back and look at the bigger picture.
This week we uncover the importance of small retailers and the big impact they are making on the retail sector in 2021.
WHAT ELSE IS IN STORE THIS WEEK?
- A look into the data that shows the scale or retail in 2021.
- Simple ways to use online orders to increase average ticket.
- Marketing with consumer trust in mind.
- Get our upcoming research reports.
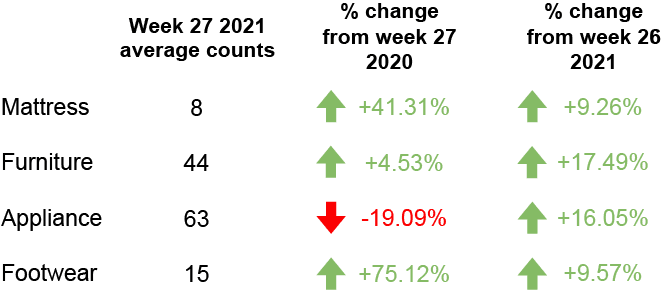
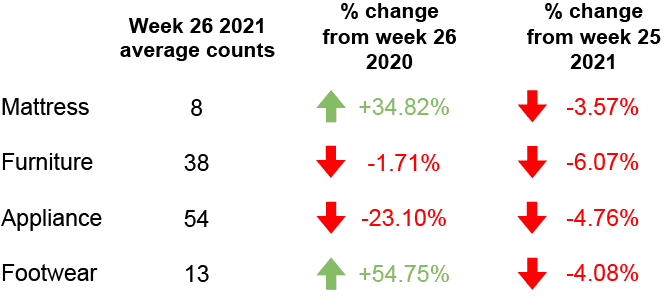
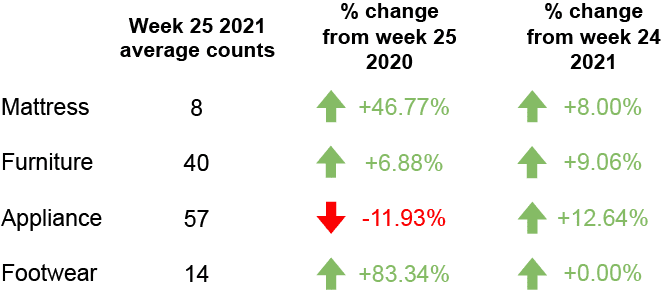
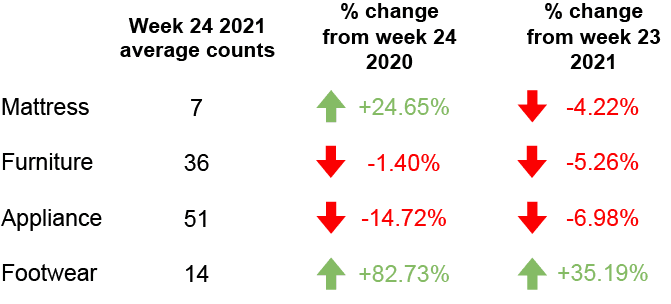
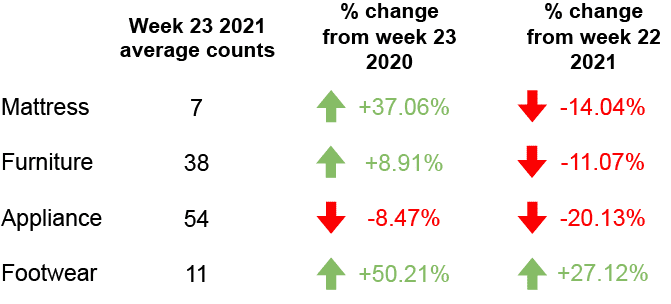
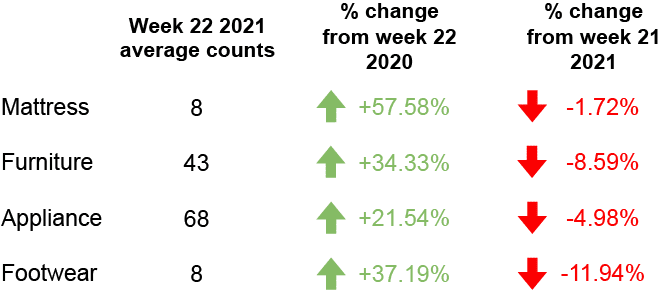
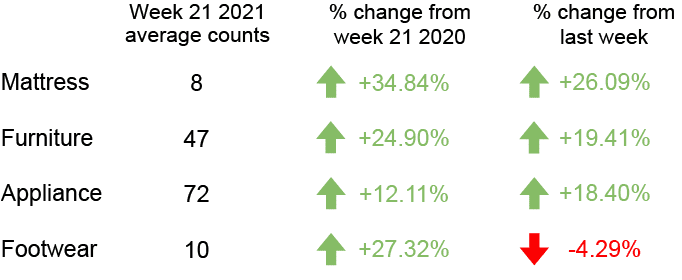
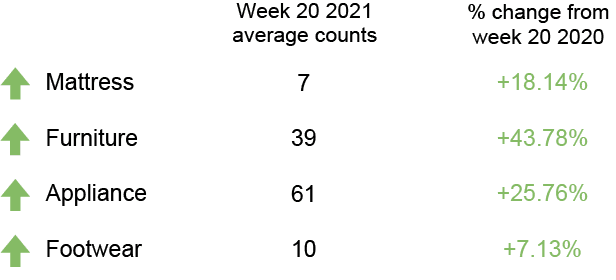
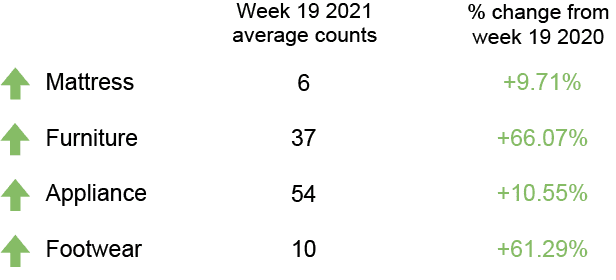
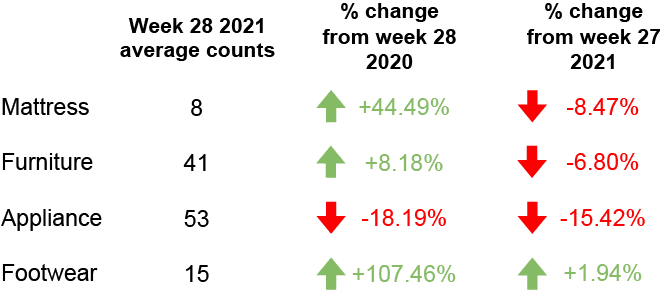
FOOT TRAFFIC INDEX
Here’s a look at last week’s foot traffic compared to the same time last year.
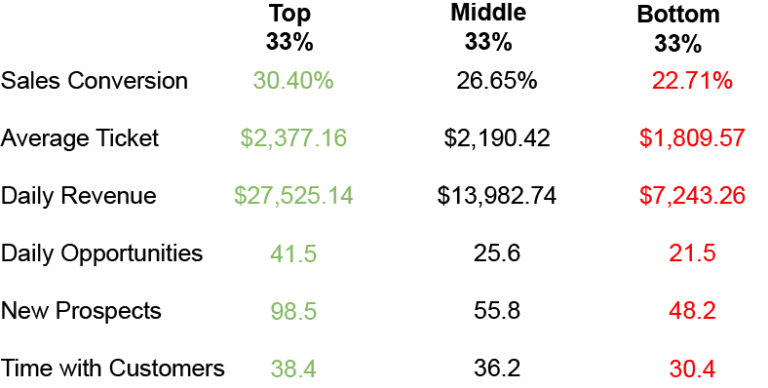
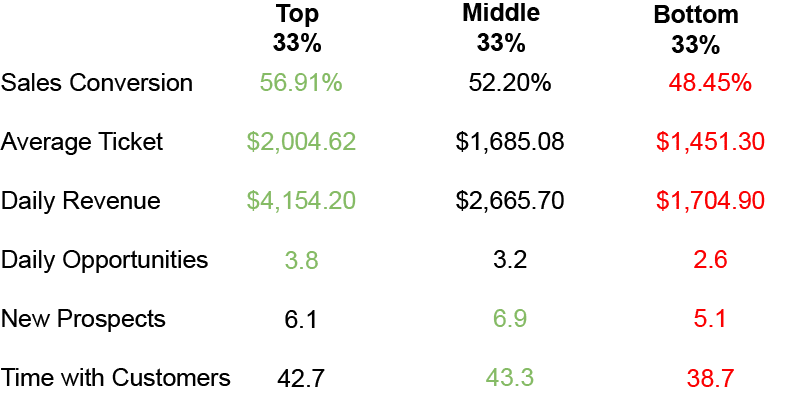
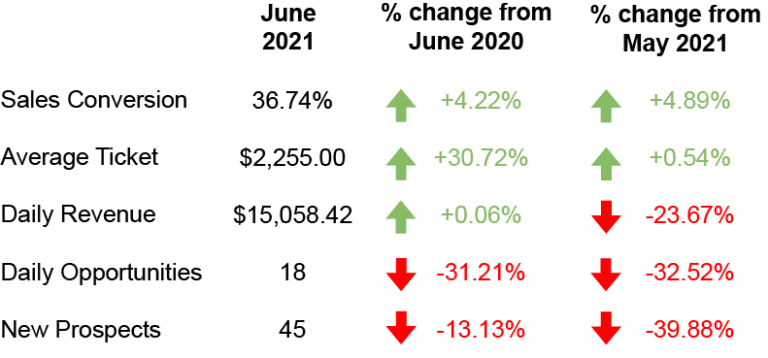
FOOT TRAFFIC TRENDS
Industry insights so you can convert your foot traffic into more sales.
Retail: the bigger picture
Sometimes while searching the internet you find an article or paper that is jammed pack with useful information. This week, that article was Retail Statistics You Should Know by Small Biz Trends.
Although key performance metrics are important to watch, this week we take a look at data that captures the bigger picture of retail.
In Q1 of 2021, Non-e-commerce sales were 86% of total retail sales in the US during the quarter. Although it may feel like e-commerce is gaining momentum, shoppers are still adamant about shopping in physical stores.
62% of shoppers still prefer shopping in-store because they can see and feel the product themselves. In the same survey, 49% of people prefer in-store because of the speed they can get their product compared to online shopping.
One stat that caught my eyes was that 56% of shoppers are more likely to buy if the salesperson simply remembers their name. The customer’s experience can be night and day by the small act of listening and making them feel heard.
I would recommend everyone to take a look at the article above because it is jam-packed with actionable data you can implement in your business.

Small retailers take the win
Small retailers don’t sell at the same level as major corporations but pack a major punch when it comes to other metrics.
For starters, small retailers are not small when it comes to contributing to the economy. A recent report by score.org breaks down the importance of retailers with less than 50 employees.
Small retailers employ 39.8% of all retail employees. In addition, retailers with less than 50 employees make up 98.6 of all retail firms, adding up to nearly 131,470 small specialty retail stores in the US in 2021.
The title of small retailer does not do justice for the impact and scale of the group as a whole. As they say, there is always power in numbers, and small retailers more than have the numbers.
Using online orders to increase average ticket
While one would usually assume that in-store visits result in higher average tickets, the potential value of the sale can be significantly higher when the right strategies are used.
First, we have to understand why shoppers are shopping for your product online in the first place. 65% of consumers conduct online product research before entering a store. With that, shoppers are more likely than not to go on your website before entering a physical store.
If you can chat or communicate with customers when they are in the research phase, the more likely they are to buy from you.
A simple yet effective way to increase your average ticket online is to introduce or raise your free shipping threshold. There have been endless psychological studies that show how much people love free shipping. Sadly, I’m guilty of spending more on a product that has free shipping than I am to buy a cheaper product with a shipping cost.
Get our upcoming research report:
Building a high-performance sales team
There is data that clearly points to better sales results. The question is, can you see it from anywhere, on any device? Either way, our upcoming research report will give you the insights you need to win. Here are some of the top questions we answer for YOU!
If you have Doorcounts, chances are you probably know the answers to these questions. The sales game is more competitive than ever. But, there are always ways to dominate when you have the right data and know how to use it. |
NOTEWORTHY NEWS
Loyal customers: The keys to building a modernized loyalty & rewards program.
Sustainable retail: 5 reasons you should adopt a circular economy business model.
Technology wins: June retail sales show the importance of retail technology innovations.
RANDOM IRRELEVANCE
Unlikely sighting: A 100-pound tropical fish was discovered on a beach in Oregon.
National Ice Cream Day: Where to score free or discounted treats on the big holiday.
The second sighting: After capturing the first photo of a black hole, the Event Horizon Telescope zooms in on a second.