December 21, 2020
Retail Traffic Trends #5: Does November show signs of normal?

We are excited to share some November data that gets our palms sweating at the thought of things finally returning to normal.
Luckily for all of us, the November trends are very promising.
WHAT’S IN THIS WEEK’S EDITION, YOU ASK?:
- November in review: How did holiday shopping compare to last year?
- Rethinking customer engagement: What does it take to bring customers into your store?
- Much much more…
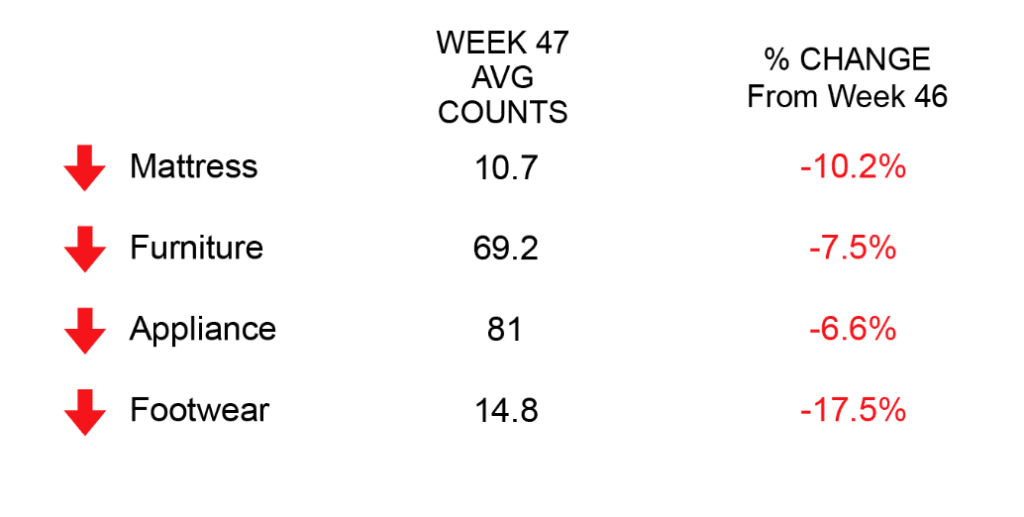
FOOT TRAFFIC INDEX

DC FEATURE OF THE WEEK
Advertising: The advertising tab allows managers to see which types of advertising brought people into the store and which forms are the most effective.
To take a deep dive into which types of advertising are working and which aren’t, the advertising tab breaks down into:
- Sales — advertising source that resulted in a sale
- Potential sale — the source resulted in a potential sale
- No sale — see which advertising result in no sales
- All — all advertising that brought people into your store.
FOOT TRAFFIC TRENDS
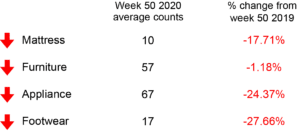
This week we are taking a look at the key metrics of November 2019 vs 2020. Also, we look at all the months in-between — for those who enjoy the thrill of a scary ride.
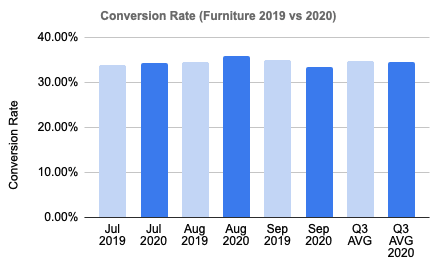
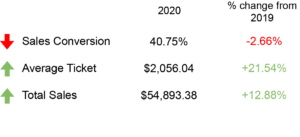
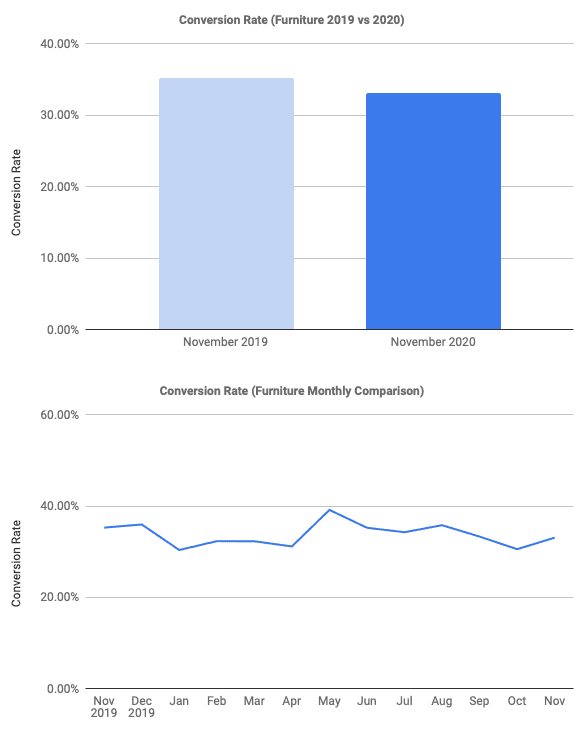
November 2020 furniture key metrics (2019 vs 2020)
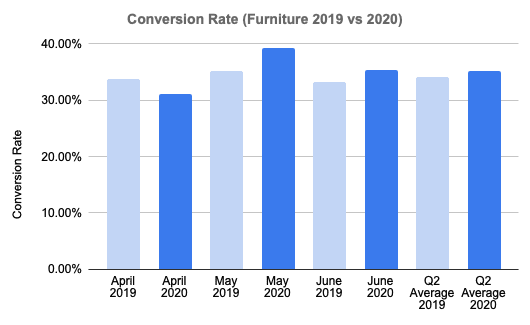
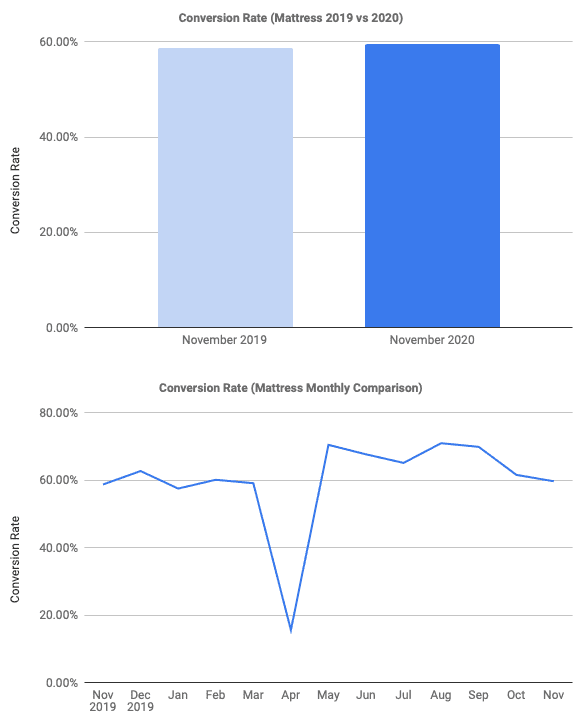
Conversion rate down 6.26%
Conversion rate in the furniture industry has stayed incredibly consistent throughout a year with many challenges for the retail industry. Despite lockdowns affecting the overall foot traffic, those who do go into furniture stores are just as likely to purchase as they were last November.
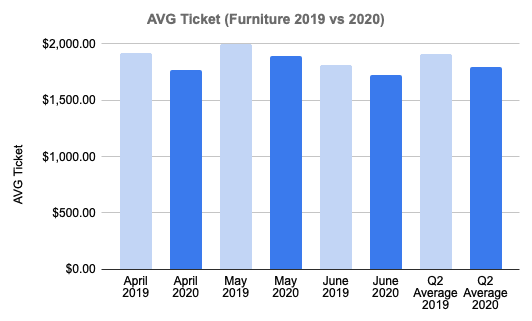
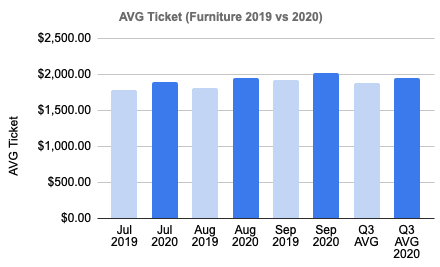
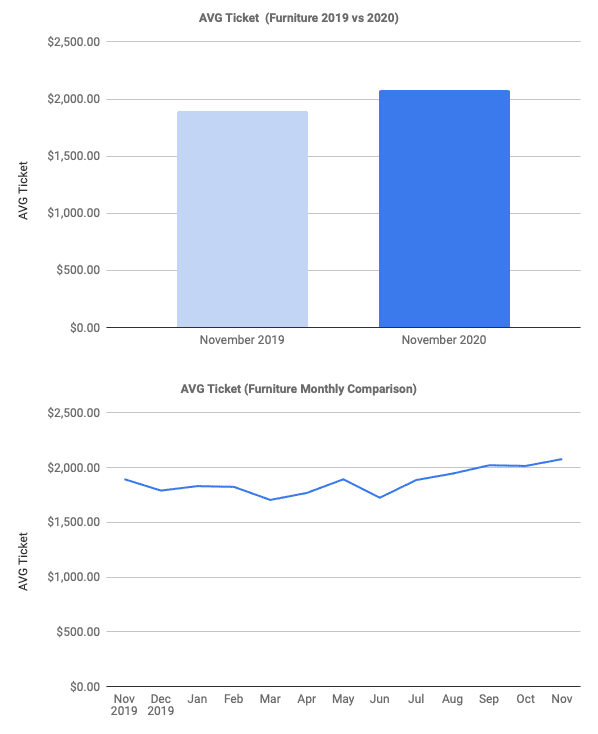
Average ticket up 9.7%
The furniture industry was able to skate through the year without lockdowns significantly affecting their average ticket. From May and on we are finally able to see the retail industry slowly return to normal, or as normal as we could hope for this year.
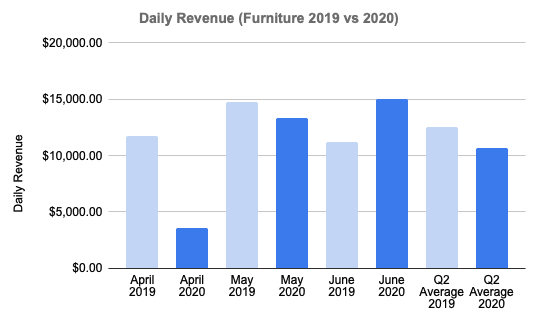
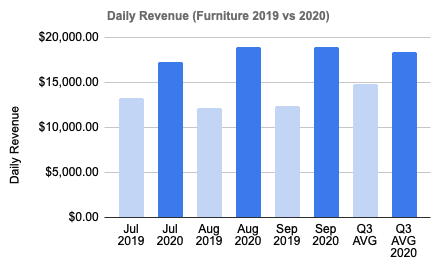
Daily revenue up 0.43%
As we would expect, daily revenue took a major fall in April when lockdown restrictions began to be in play. Daily revenue went from hitting a low of $3,553 in April to bouncing back to a 0.43% increase over last November.
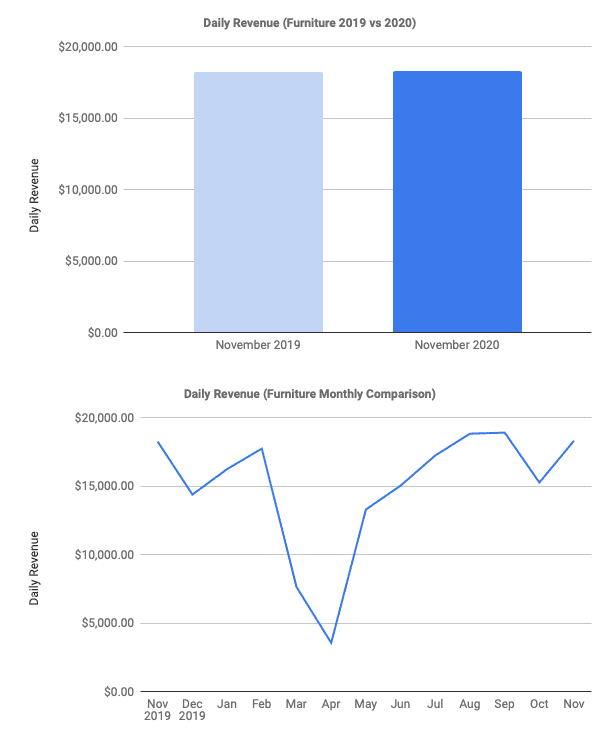
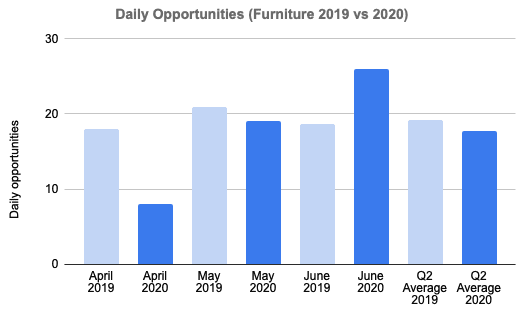
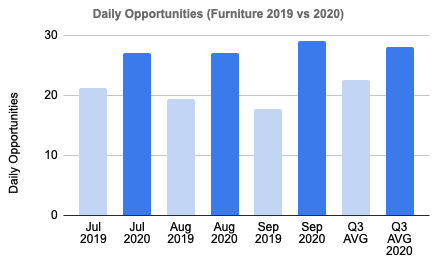
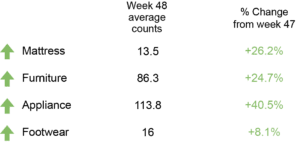
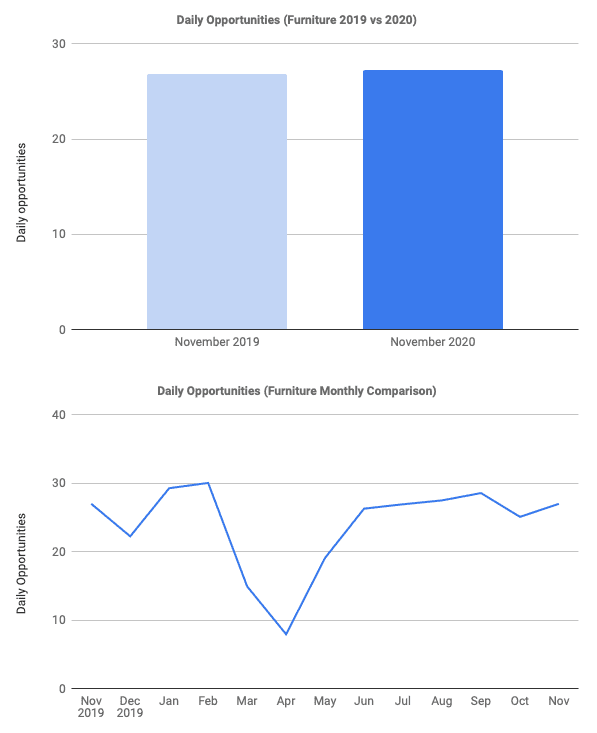
Daily opportunities up 1.55%
Yes. You read that right. Foot traffic is up 1.55% from last November. For the record, last November was a completely normal month–no virus and no pandemic. Thanks to shoppers continuing to go to Brick-and-Mortar stores from May and on, foot traffic went from a low of 8 in April to 27 in November.
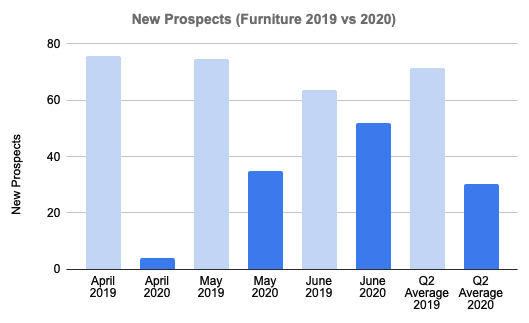
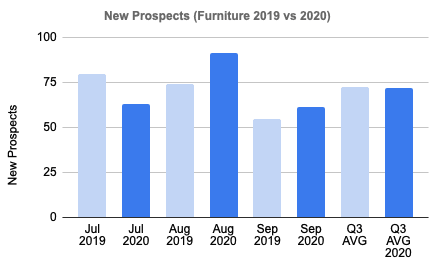
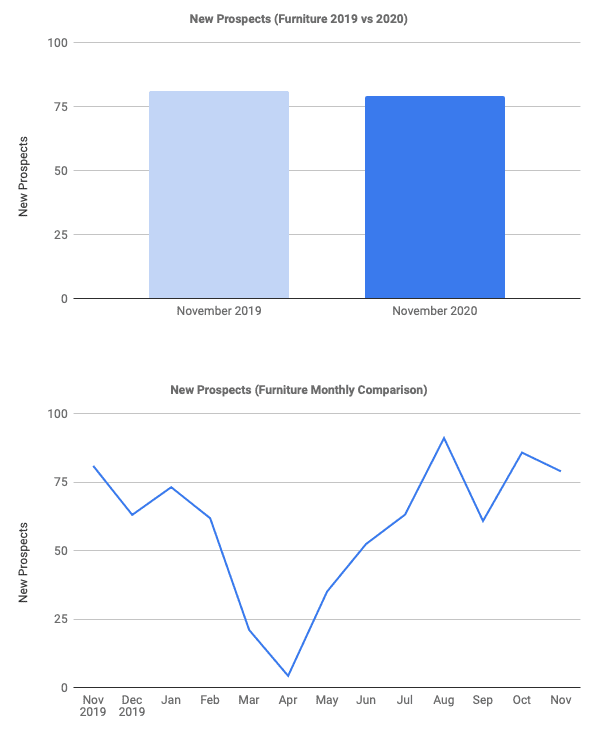
Daily prospects down 2.16%
Also known as grinches, or people who left the store without buying. Surprisingly, the pandemic did not stop people from continuing to go into furniture stores without buying. With only a 2.16% decrease from November 2019, it seems as if people still like to gaze in a furniture store and dream of what their house could look like.
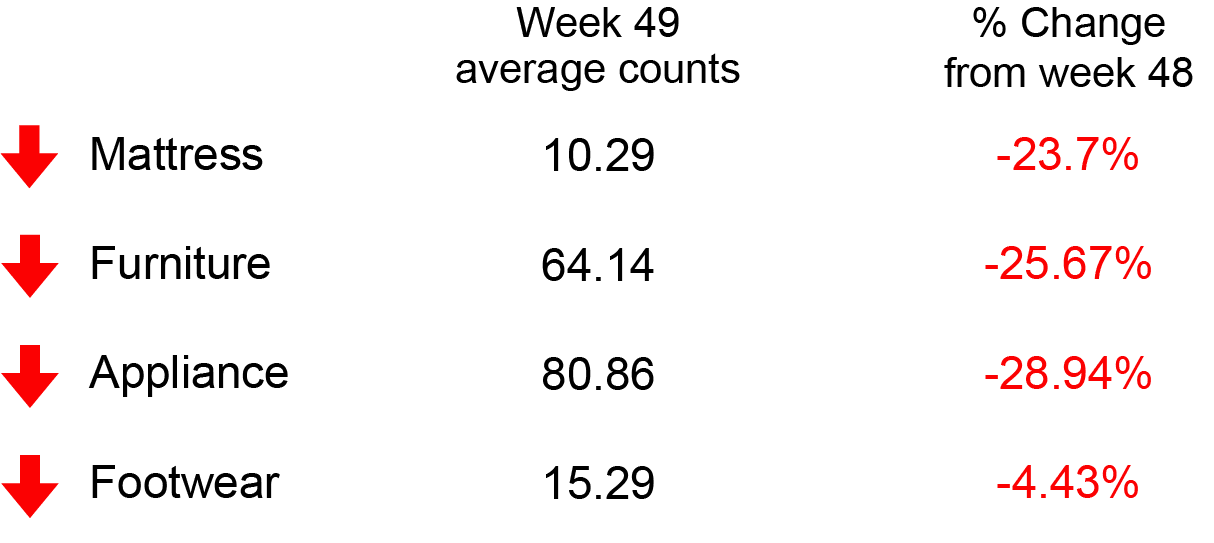
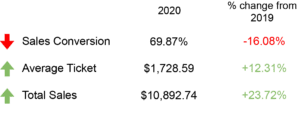
November 2020 mattress key metrics
In 2019, most mattress customers had not yet upgraded to Doorcounts 3.0 with full metric tracking vs door counts only which can create a larger disparity in certain measurements. So in some cases, we may not have the best data, but we will going forward because we have been adding new members like crazy.
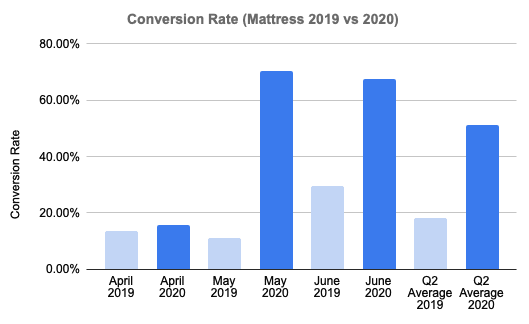
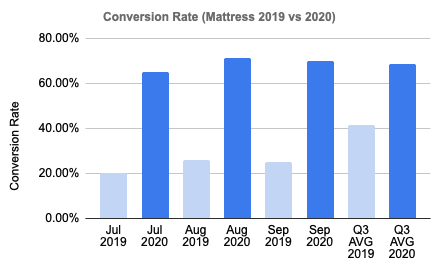
Conversion rate up 1.60%
Conversion rate in the furniture industry has stayed incredibly consistent throughout a year with many challenges for the retail industry. Despite lockdowns affecting the overall foot traffic, those who do go into furniture stores are just as likely to purchase as they were last November.
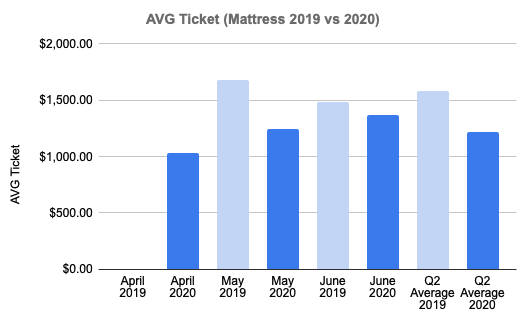
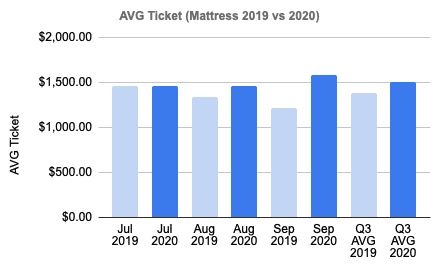
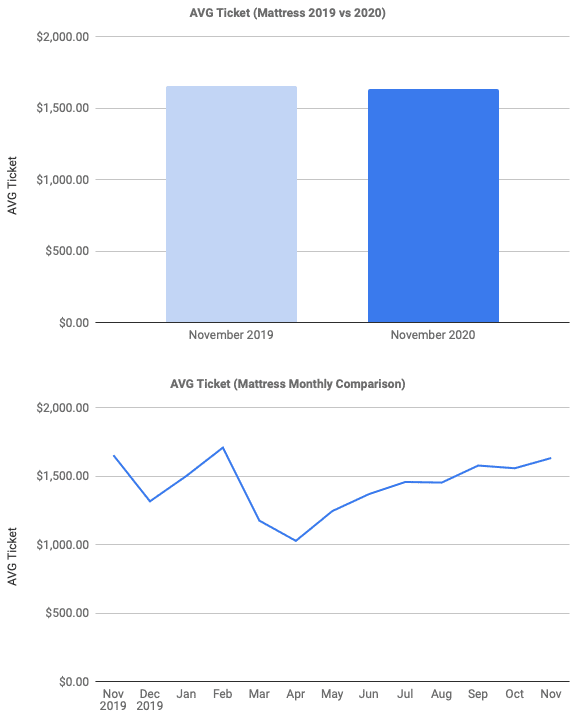
Average ticket down 1.25%
November is usually the time of the year we should start to think about getting gifts for our friends and loved ones. It seems the pandemic has resulted in people being more thoughtful about when they go to stores, and as a result, more shopping is done in November to avoid last minute shopping trips. Overall, the average ticket has almost returned to what it was last November.
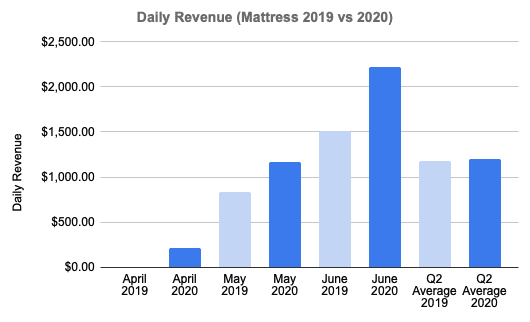
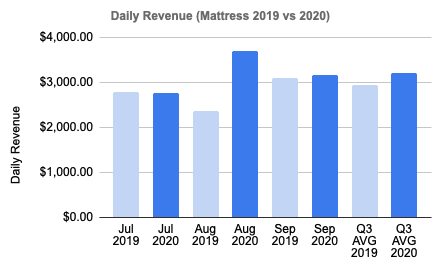
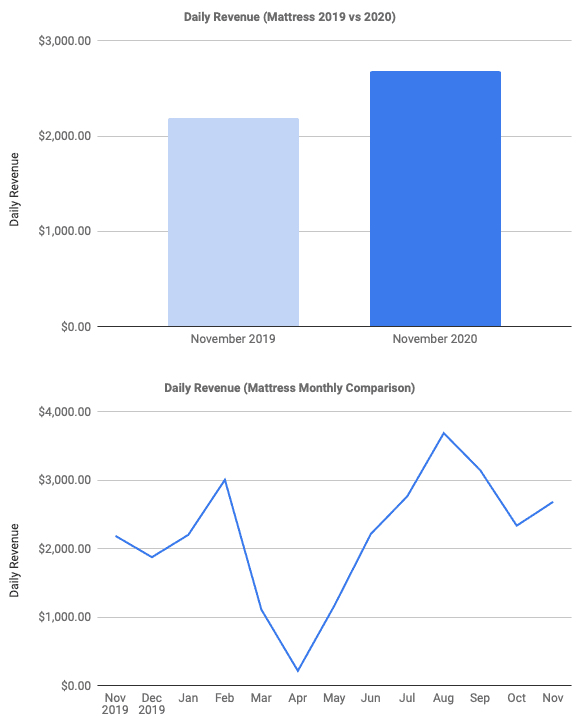
Daily revenue up 22.79%
As we said, November is usually grind-time for holiday shopping. Although this year it looks like some people went the cautious route and got their shopping done in August when the mattress industry saw their monthly high of $3,600. The mattress industry can keep their hopes high knowing that the trend is finally moving to a normal level.
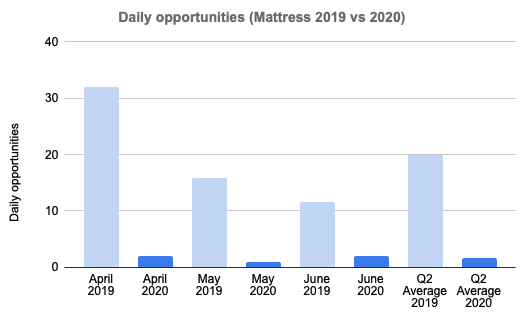
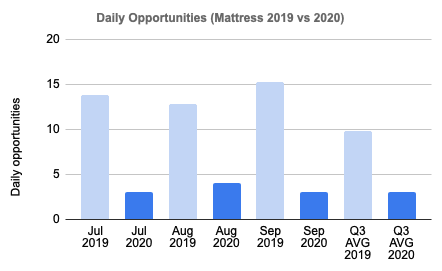
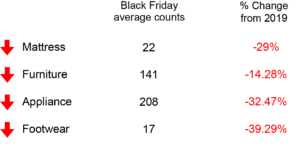
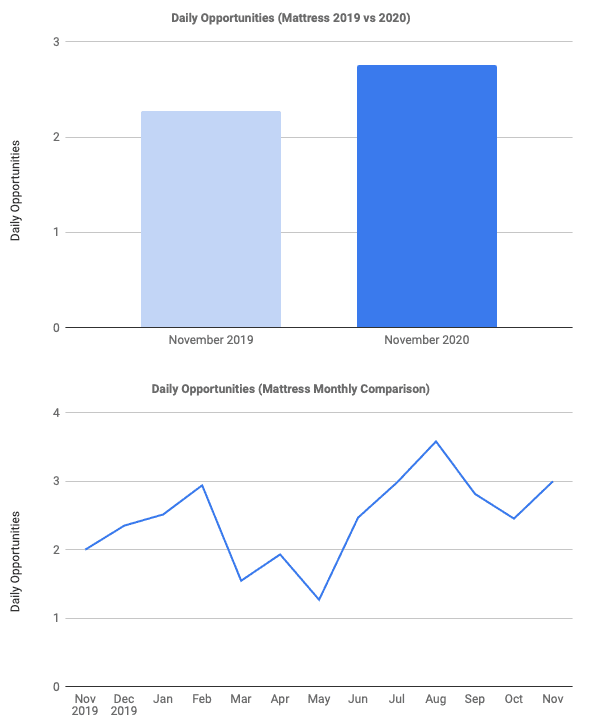
Daily opportunities up 21.22%
Once upon a time, people could walk to stores freely without the fear of social distancing or catching a virus–that time was last November. Yet somehow, the mattress industry saw a whopping 21% increase in their foot traffic over last November.
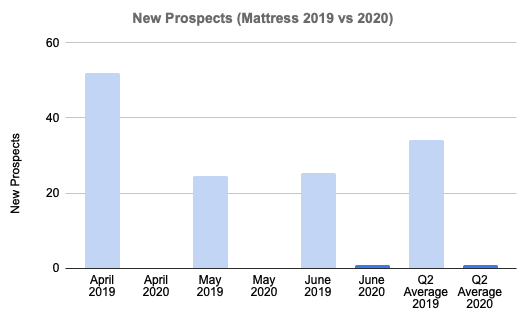
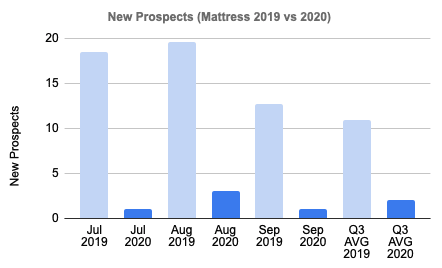
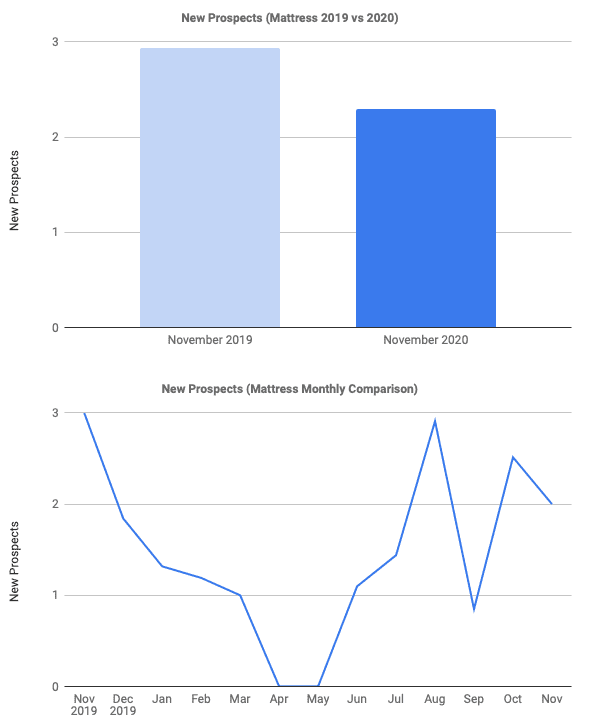
Daily prospects down 21.89%
As you may have heard us say before, daily prospects are people who walked out of a store without purchasing. You could look at new prospects being 0 in April and May as a positive, and it technically is since it means no one left the store without buying. But in reality, on average only one or two people walked into furniture stores each day during those months. On the bright side, November saw 21% fewer people walking out of furniture stores without buying.
What about appliance, footwear, and other categories?
With the number of new appliance and footwear customers joining Doorcounts in 2020, our data continues to improve. However, based on limited 2019 performance data for appliance and footwear customers, we are not able to provide meaningful data for year-over-year comparison at this time.
Rethinking customer engagement
This year was without a doubt one of the hardest years to get customers into your stores. Not only that but getting people in the store is only half the battle.
With all of the restrictions and socials distancing, how do we find the perfect balance of customer engagement?
Bloomingdale’s executive vice president and chief marketing officer Frank Berman said explains “Bloomingdale’s completely reimagined its approach to the holiday season, from our gift curation to how our customers shop and receive their gifts.”
Click Here to read more about how retailers have been rethinking their customer engagement.
NOTEWORTHY NEWS
Supply chain hacks: As many retailers have faced supply shortages throughout the pandemic, see how many retailers looking to alter their supply chains to compete in the next normal.
Retail reimagined: In the future when people look back on the most eventful years in retail, there is no question that 2020 would be top of the list.
November–Lowest in 7 months: Overall U.S. retail sales fell a seasonally adjusted 1.1% in November, the biggest drop in seven months.
Say goodbye to impulse buys: While impulse buys used to drive nearly 25% of holiday sales, customers are choosing which items to put on their list very carefully this year.
RANDOM IRRELEVANCE
Fallen Mandalorian: For all of the Mandalorian fans out there, I know this one hits a soft spot. The man who introduces us to the Mandalorian, Jeremy Bulloch dies at age 75.
Christmas cards-2020 edition: With everyone spending extra time at home this year, 2020 Christmas cards are just as 2020 as you’d expect.
Guardians of the Galaxy: Soldiers, sailors, and guardians. The men and women of the Space Force will now be called guardians.
Mass refund: Once Cyberpunk finally released after months of delays and three missed deadlines, Xbox and PlayStation removed the game from their store and offer full refunds as the game faces many development issues.