Retail Traffic Trends #6: Make your team perform better than ever

WHAT’S IN THIS WEEK’S EDITION, YOU ASK?:

Game-changers: A number of DC improvements that will make your team perform better than ever.

Thinking outside the box: How did retailers get customers into their stores in 2020?

Barstool fund: Small businesses get much needed financial support during the lockdown from an uncommon source.
Much much more…

And, here’s what’s in next week’s edition:

December in review: How did December shopping compare to last year?
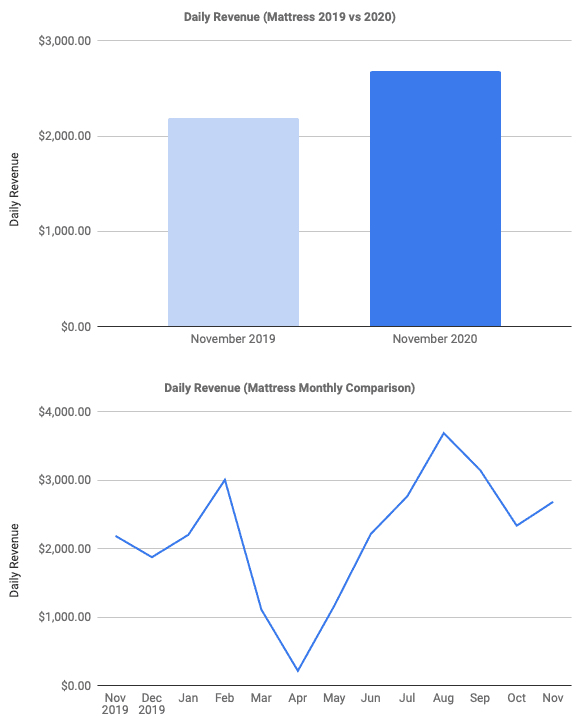
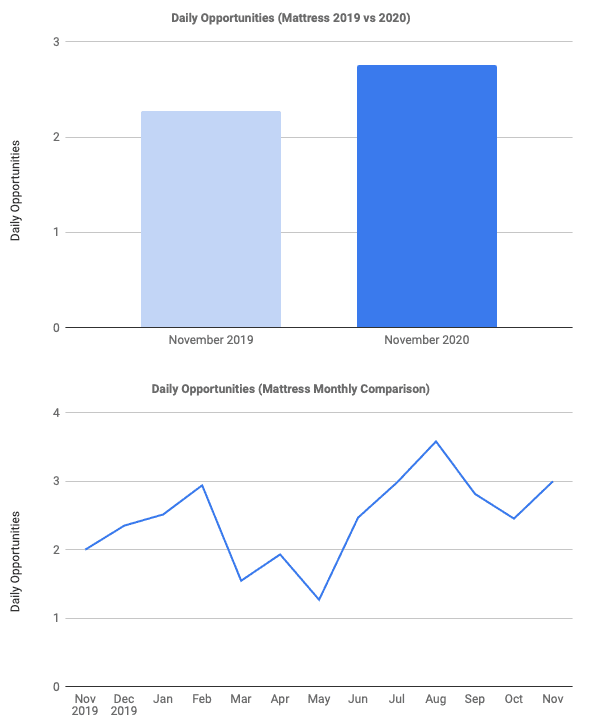
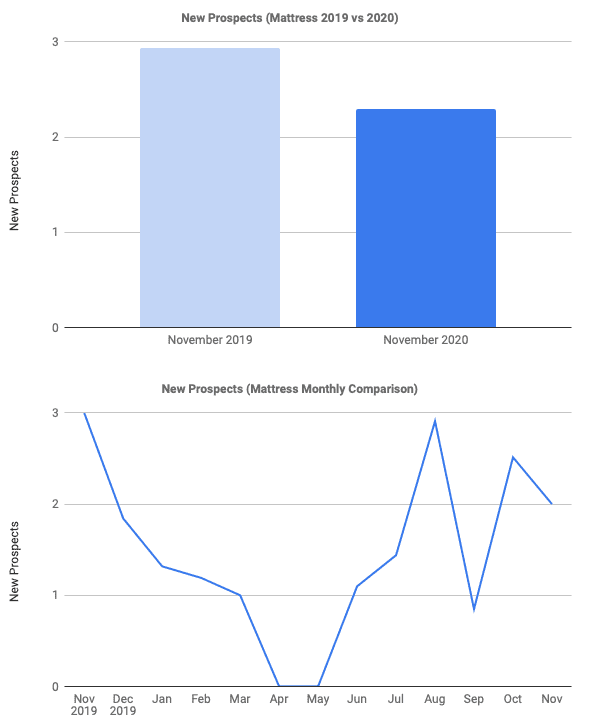
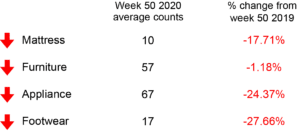
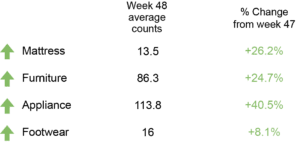
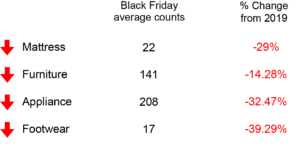
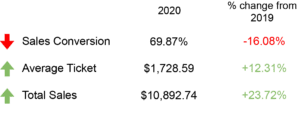
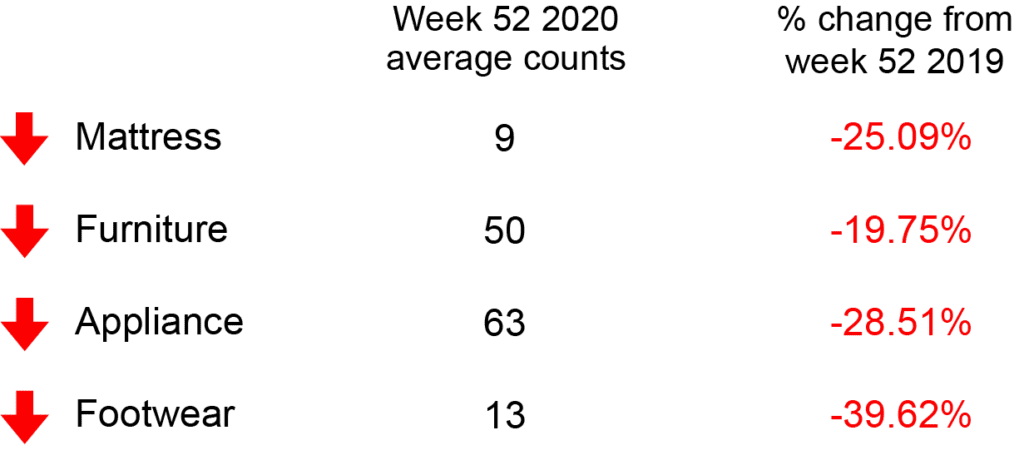
FOOT TRAFFIC INDEX

WHAT’S NEW IN DOORCOUNTS THIS WEEK?

Heres some enhancements we’ve made to Doorcounts that you will want to know about — to get a full list Click Here:

  • Now you have two company configuration options for how to collect a Podium review.
  • Assign any and all salespeople who have been involved with a particular customer.
  • See email responses from customers displayed in the email Popup.

WHAT’S IN STORE FOR THE FUTURE OF DOORCOUNTS?

Reward your salespeople: How would you like to know your sales team is inspired to perform at their best. Currently in beta, we are testing a program that allows salespeople to earn points for prizes and incentives by achieving the metrics that matter the most.

DC FEATURE OF THE WEEK

Sales Conversion: Once a period is selected, Doorcounts will display the sales conversion at a company level, showing the sales conversion for each store.

To take a deep dive into a specific store, simply click the store name on the graph and it will show the sales conversion for all of the employees in that store. To take things even further, you can click an individual salesperson and see their sales conversion for each day in the selected time period.

By clicking the Salesperson rank button, you will be able to see the ranking of your salespeople by sales conversion.

FOOT TRAFFIC TRENDS

This week we are taking a look at retailers who thought outside of the box to get people into their stores. This year was a year wherein most cases, a BOGO deal was not going to cut it.

Window decorating contest
In a time where most people would rather get things off amazon than go to a brick-and-mortar store, the Roscoe Village Chamber of Commerce decided they needed to do something. All through December, the village competed in a “window decorating” contest to drive people into their stores.

From hanging wine bottles to extravagant trees, the entire block was filled with eye dropping displays. The uptick in traffic from the displays has resulted in some store owners choosing to keep their displays up past the holiday season.

Virtual Checkout
We restrained from putting amazon in the title as we knew it was probably the last thing most retailers want to hear about.

Although most would consider Amazon the killer of retail, their new “Go” stores are something for retailers to keep their eyes on.

The Amazon Go stores allow people to pay by simply walking out of the store. No checkout required. No human interaction required.

Amazon has made this possible by ensuring you have the Go app downloaded before entering the store– you cannot enter without the app.

The app can figure out which items you have picked up, and you instantly get charged after leaving the store.

Click Here to learn more about the virtual checkout.

In-store Beacons
One of the major shopping trends of 2020 was people going into stores knowing exactly what they want. Most people would choose to have a shopping trip be as quick as possible instead of shopping around.

Retailers have begun using in-store beacons so that customers can make sure the product is at the store.

Beacons allow a message to be sent to the customer to help them find the product they are looking for.

Making products easier to find helps customers feel they are not being exposed for longer than they need to be.

Learn More about other technologies being used to help customers navigate through stores.

Barstool Fund
Barstool sports is here for small businesses. The fund will choose businesses that need help and will financially support them until the pandemic is over.

In the last 7 days, Barstool has raised over 7 million dollars to support small businesses in need.

If you are a small business that is struggling to make ends meet during the pandemic, send your story to the Barstool fund.

If you would like to donate and support small business, Donate Here.

To read more about the small businesses being supported through the Barstool fund, Click Here.

Small businesses, we are all rooting for you!

How much money are you losing because of traffic blindness?

Here’s a “mockumentary” style video on traffic blindness and how YOU can recognize the early signs of this silent killer of sales. Watch, enjoy a good laugh, and learn what you can do to cure your traffic blindness and convert your foot traffic into more sales.

A MUST READ — Come Back To Bed

The minds behinds the Dos Marcos Podcast have released their new book.

In COME BACK TO BED, Mark Kinsley and Mark Quinn offer strategies and principles that retailers can use to forge lasting customer relationships that will weather any storm.

Purchase the book HERE.

NOTEWORTHY NEWS

Virtual Joy: Up until recently, the joy of shopping in stores and physically touching products was unmatched. New technology has made the in-store experience possible from home.

Toilet paper takes the win: The annual Forbes Retail Awards takes a look back at the products that made 2020.

Retail Predictions:
This year has resulted in many new tactics for retail stores. See which retail trends will stay with us through the years.


Gift cards save the day:
Gift cards were the go-to gift for many shoppers this year compared to previous years. See how gift cards may hurt retailers this year, but be their saving grace in 2021.

RANDOM IRRELEVANCE

Snowflame: Who needs a snow shovel when you have a flamethrower? Watch the video of a Kentucky man using a flamethrower to get the snow off of his driveway.

KFCstation: The fast-food giant has released a chicken-warming game console to compete against Xbox and Playstation. Yes. We will be pre-ordering.

Ping pong X martial arts:
A man has made it in the Guinness book of world records for hitting 34 ping pongs with a numb chuck. To make things even weirder, he was playing against a robot. Side note: this was to beat his own world record.

Space ashes: A star trek actor had his ashes secretly sent to space. See how the ashes were hidden on the International Space Station for 12 years.

Read More

Retail Traffic Trends #5: Does November show signs of normal?

We are excited to share some November data that gets our palms sweating at the thought of things finally returning to normal.

Luckily for all of us, the November trends are very promising.

WHAT’S IN THIS WEEK’S EDITION, YOU ASK?:

  • November in review: How did holiday shopping compare to last year?
  • Rethinking customer engagement: What does it take to bring customers into your store?
  • Much much more…
Here’s what’s in next week’s edition:
Next week we will share the best retail stories of the year. This year was a year where creativity played a major role in getting people into stores. Stay tuned to see the unique ways people kept their stores alive this year.
 

FOOT TRAFFIC INDEX 


DC FEATURE OF THE WEEK

Advertising: The advertising tab allows managers to see which types of advertising brought people into the store and which forms are the most effective.

To take a deep dive into which types of advertising are working and which aren’t, the advertising tab breaks down into:

  • Sales — advertising source that resulted in a sale
  • Potential sale — the source resulted in a potential sale
  • No sale — see which advertising result in no sales
  • All — all advertising that brought people into your store.


FOOT TRAFFIC TRENDS

This week we are taking a look at the key metrics of November 2019 vs 2020. Also, we look at all the months in-between — for those who enjoy the thrill of a scary ride.


November 2020 furniture key metrics (2019 vs 2020)

 
The November metrics for the furniture industry are very promising, to say the least. While there were many ups and downs throughout the year, November is showing signs of normal.

Conversion rate down 6.26%
Conversion rate in the furniture industry has stayed incredibly consistent throughout a year with many challenges for the retail industry. Despite lockdowns affecting the overall foot traffic, those who do go into furniture stores are just as likely to purchase as they were last November.

Average ticket up 9.7%
The furniture industry was able to skate through the year without lockdowns significantly affecting their average ticket. From May and on we are finally able to see the retail industry slowly return to normal, or as normal as we could hope for this year.

Daily revenue up 0.43%
As we would expect, daily revenue took a major fall in April when lockdown restrictions began to be in play. Daily revenue went from hitting a low of $3,553 in April to bouncing back to a 0.43% increase over last November.

Daily opportunities up 1.55%
Yes. You read that right. Foot traffic is up 1.55% from last November. For the record, last November was a completely normal month–no virus and no pandemic. Thanks to shoppers continuing to go to Brick-and-Mortar stores from May and on, foot traffic went from a low of 8 in April to 27 in November.

Daily prospects down 2.16%
Also known as grinches, or people who left the store without buying. Surprisingly, the pandemic did not stop people from continuing to go into furniture stores without buying. With only a 2.16% decrease from November 2019, it seems as if people still like to gaze in a furniture store and dream of what their house could look like.

November 2020 mattress key metrics

In 2019, most mattress customers had not yet upgraded to Doorcounts 3.0 with full metric tracking vs door counts only which can create a larger disparity in certain measurements. So in some cases, we may not have the best data, but we will going forward because we have been adding new members like crazy.

Conversion rate up 1.60%
Conversion rate in the furniture industry has stayed incredibly consistent throughout a year with many challenges for the retail industry. Despite lockdowns affecting the overall foot traffic, those who do go into furniture stores are just as likely to purchase as they were last November.

Average ticket down 1.25%
November is usually the time of the year we should start to think about getting gifts for our friends and loved ones. It seems the pandemic has resulted in people being more thoughtful about when they go to stores, and as a result, more shopping is done in November to avoid last minute shopping trips. Overall, the average ticket has almost returned to what it was last November.

Daily revenue up 22.79%
As we said, November is usually grind-time for holiday shopping. Although this year it looks like some people went the cautious route and got their shopping done in August when the mattress industry saw their monthly high of $3,600. The mattress industry can keep their hopes high knowing that the trend is finally moving to a normal level.

Daily opportunities up 21.22%
Once upon a time, people could walk to stores freely without the fear of social distancing or catching a virus–that time was last November. Yet somehow, the mattress industry saw a whopping 21% increase in their foot traffic over last November.

Daily prospects down 21.89%
As you may have heard us say before, daily prospects are people who walked out of a store without purchasing. You could look at new prospects being 0 in April and May as a positive, and it technically is since it means no one left the store without buying. But in reality, on average only one or two people walked into furniture stores each day during those months. On the bright side, November saw 21% fewer people walking out of furniture stores without buying.

What about appliance, footwear, and other categories?

With the number of new appliance and footwear customers joining Doorcounts in 2020, our data continues to improve. However, based on limited 2019 performance data for appliance and footwear customers, we are not able to provide meaningful data for year-over-year comparison at this time.

Rethinking customer engagement

This year was without a doubt one of the hardest years to get customers into your stores. Not only that but getting people in the store is only half the battle.

With all of the restrictions and socials distancing, how do we find the perfect balance of customer engagement?
Bloomingdale’s executive vice president and chief marketing officer Frank Berman said explains “Bloomingdale’s completely reimagined its approach to the holiday season, from our gift curation to how our customers shop and receive their gifts.”

Click Here to read more about how retailers have been rethinking their customer engagement.

NOTEWORTHY NEWS

Supply chain hacks: As many retailers have faced supply shortages throughout the pandemic, see how many retailers looking to alter their supply chains to compete in the next normal.

Retail reimagined: In the future when people look back on the most eventful years in retail, there is no question that 2020 would be top of the list.

November–Lowest in 7 months: Overall U.S. retail sales fell a seasonally adjusted 1.1% in November, the biggest drop in seven months.

Say goodbye to impulse buys: While impulse buys used to drive nearly 25% of holiday sales, customers are choosing which items to put on their list very carefully this year.

RANDOM IRRELEVANCE

Fallen Mandalorian: For all of the Mandalorian fans out there, I know this one hits a soft spot. The man who introduces us to the Mandalorian, Jeremy Bulloch dies at age 75.

Christmas cards-2020 edition: With everyone spending extra time at home this year, 2020 Christmas cards are just as 2020 as you’d expect.

Guardians of the Galaxy: Soldiers, sailors, and guardians. The men and women of the Space Force will now be called guardians.

Mass refund: Once Cyberpunk finally released after months of delays and three missed deadlines, Xbox and PlayStation removed the game from their store and offer full refunds as the game faces many development issues.

Read More

Retail Traffic Trends #4: Mattress Sales Up 183%, How does your store compare?

Did you know mattress sales were up 183% in the second quarter of 2020 over 2019? Check out below to see other interesting facts about Q2 2020.

This week we take a deep dive into the quarters most impacted by Covid. Q2 was the first quarter most states were placed under lockdown restrictions, and for many, this resulted in their stores being forced to close.

WHAT’S IN THIS WEEK’S EDITION, YOU ASK?

  • Second-quarter year-over-year benchmark report: How did Covid affect retail?
  • Augmented reality: A showroom’s best friend or biggest rival?
  • The underdog story: Amazon finally meets its match.
  • Dos Marcos: How a single word shifted the mattress industry.
  • Much much more…

Here’s what’s in next weeks edition:

Next week we will release our holiday edition. Make sure you don’t miss it or you might get a piece of coal in your stocking.

FOOT TRAFFIC INDEX

This week we decided to change up our traffic index a little bit. Instead of comparing last week to the week prior, we are now going to compare last week to the same time last year. We felt this was a more valuable comparison of how the year is going.

Last week, week 50, saw a 16.94% decrease over week 50 2019. All things considered, this is pretty good.

DC FEATURE OF THE WEEK

Dashboard: The dashboard allows managers to see multiple reports and sales statistics in one convenient place. Simply click which store and date range you are interested in and Doorcounts will do the rest.

Within the dashboard, you can compare your stores against one another, or take a deep dive into a specific store and see the data on a salesperson level.

FOOT TRAFFIC TRENDS

This week we are taking a look at the key metrics of Q2 2019 vs Q2 2020. If anything, we were able to confirm our theory that the retail industry can handle anything that is thrown at it.

Q2 furniture key metrics (2019 vs 2020)

It’s amazing to think about how different Q2 last year was from this year. Some great movies came out during Q2 of last year, and now the thought of going to a movie theater sounds preposterous. Luckily, everyone needs furniture to watch Netflix.

Conversion rate

Despite the crazy restrictions on the retail industry in Q2 this year, the furniture industry was able to show no fear. The year-over-year conversion rate had a 15% increase over Q2 2019. We recommend keeping your eyes on this chart for as long as possible, it doesn’t get much better after this.

Average ticket
What’s second-best to an increase year-over-year? — a small decrease. With that kind of mindset, we are in luck. Year-over-year average ticket saw a 3% decrease from Q2 2019. Not bad at all.

Daily revenue
We assumed daily revenue would completely drop, but similar to the mattress industry, the furniture industry was able to stay afloat. Year-over-year daily revenue saw a 15% decrease over 2019. It’s like traffic –It can slow you down but doesn’t completely stop you.

Daily opportunities
The furniture industry can sleep well knowing that their foot traffic stayed stable during a time when people were told to stay inside. Unlike the mattress industry who saw a 92% decrease in daily opportunities, Q2 2020 only saw an 8% decrease in foot traffic from 2019 in the mattress industry.

Daily prospects
Daily prospects is a fancy way to say people who left the store without buying (that is if your salespeople got their information before they left). Unfortunately for all the window shoppers out there, it looks like that trend may be coming to an end. Shoppers are going to stores to buy rather than look this year, which resulted in Q2 2020 seeing a 57% decrease in daily prospects from 2019 in the mattress industry.

Q2 mattress key metrics (2019 vs 2020)

In 2019, most mattress customers had not yet upgraded to Doorcounts 3.0 with full metric tracking vs door counts only which can create a larger disparity in certain measurements. So in some cases, we may not have the best data, but we will in the future because we’ve been adding new mattress stores like crazy.

Conversion rate
Similar to Q3, those who showed up to stores this year, REALLY showed up. The year-over-year conversion rate had a 183% increase over Q2 2019. Last week we got hyped for the mattress industry, and this week we do the exact same (and then some.)

Average ticket
Year-over-year average ticket saw a 23% decrease from Q2 2019. Although salespeople are converting more sales, shoppers went from getting add-ons to looking for take-offs. On the bright side, the average ticket continues to increase month after month this year.

Daily revenue
When we first saw this chart, the first thing that came to our minds was Cingular Wireless (for those of you who remember their “Raising the Bar” ads.) Similar to 2019, daily revenue saw a solid growth throughout Q2 which resulted in a year-over-year increase of 2% over 2019.

Daily opportunities
Overall, Q2 2020 saw a 92% decrease in foot traffic from 2019 in the mattress industry. Before we began sorting through the data, we assumed most of Q2 2020 would look exactly like this chart does. With major lockdowns throughout most cities in Q2, a 92% decrease is probably better than most would’ve expected. See the Q3 comeback in last week’s traffic trends.

Daily prospects
Like we said last week, daily prospects is a fancy way to say people who left the store without buying (that is if your salespeople got their information before they left). Anytime we see daily prospects go down, it’s a sign that salespeople are doing something right (as they always do.) Q2 Year-over-year daily prospects saw a 97% decrease over 2019. People aren’t messing around about their sleep this year.

What about appliance, footwear, and other categories?
With the number of new appliance and footwear customers joining Doorcounts in 2020, our data continues to improve. However, based on limited 2019 performance data for appliance and footwear customers, we are not able to provide meaningful data for year-over-year comparison at this time.

The word that changed everything

When the trend switched from “spring” to “foam” mattresses, Leggett & Platt found itself in a difficult position.

They needed to flip the script. So they did.

…The “hybrid” was born.

Read the full story about how our very own Mark Kinsley, of Dos Marcos fame, turned a dire situation into a golden opportunity.

How much money are you losing because of traffic blindness?

Here’s a “mockumentary” style video on traffic blindness and how YOU can recognize the early signs of this silent killer of sales. Watch, enjoy a good laugh, and learn what you can do to cure your traffic blindness and convert your foot traffic into more sales.

Watch the video here.

NOTEWORTHY NEWS

As you start your Wednesday, here’s a rundown of last week…

Showrooms–at home?: See how augmented reality will change the showroom experience and help you sell more products.

Future of commerce: “The Future of Commerce 2021” is Shopify’s first annual report, using its global retailer and consumer data to predict changes in the retail landscape during the new year.

Stock watch: The holidays are prime time for retail stocks, but obviously things are very different this year. See which retail stocks to watch this December.

Shopping habits change job availabilities: The job market has done a flip as shoppers change their shopping habits.

How, where, and when: Spending patterns this shopping season show in-store purchases down 16% at department stores but up 212% online.

RANDOM IRRELEVANCE

Mt Everest…grows?: The world’s highest mountain Mount Everest is 0.86m higher than had been previously officially calculated, Nepal and China have jointly announced.

Boss ladies: See the women that are changing the world.

Amazon’s new biggest rival: Amazon has completely taken over the book market (and the world?) But things are about to change.

2020 in pictures: There are a lot of words that could be used to describe 2020. Instead, let’s look at some pictures that describe 2020.

Read More

Retail Traffic Trends #2: Black Friday Benchmark Report

Welcome to our week 48 wrap up. There’s a lot to catch up on this week with Black Friday in the rearview mirror.

No one really knew what to expect on Black Friday, but it was assumed that traffic would not be the same as last year.

It’s almost as if this year retailers made the unspoken agreement that it will be a “cyber month” instead of relying on one day for major traffic to drive sales.

For many this year, doorbuster deals have turned into cyber deals. This is because the thought of having their stores packed with crazy customers fighting over the newest gadget didn’t seem like a good idea.

HERE’S LAST WEEK’S FOOT TRAFFIC (WEEK 48-47 COMPARISON)

Even though Black Friday 2020 traffic was down compared to Black Friday 2019, foot traffic from last week was up 24.8% over the previous week.

BLACK FRIDAY BENCHMARK REPORT (2020/2019 COMPARISON)

As expected, overall retail foot traffic was down 52% from Black Friday last year according to Sensormatic Solutions. Although this is a major drop, it’s worth noting that these numbers are watered down due to retailers offering holiday deals as early as October to compensate for the impact of the pandemic.

Brick-and-mortar retailers can stay optimistic knowing that most shoppers are spreading out their shopping over the holiday season. This year, slow and steady will win the race.

How our customers experienced Black Friday
Although most reports show around a 50% decrease in overall traffic from Black Friday last year, on average our customers saw only a 28.7% decrease in year-over-year foot traffic.

Black Friday Furniture industry key metrics
This year sales conversion for our customers actually dropped by 2.66% over 2019. At the same time, average ticket increased by 21.54% and total sales increased by 12.88%.

Black Friday mattress industry key metrics
This year sales conversion for our customers actually dropped by 16.08% over 2019. At the same time, average ticket increased by 12.31% and total sales increased by 23.72%.

retail traffic benchmark

What about appliance and footwear?
Based on the limited number of appliance and footwear customers, we are not able to provide meaningful data for year-over-year comparison at this time. However, with the number of new appliance and footwear customers coming on board, we will be able to next year.

DOORCOUNTS FEATURE OF THE WEEK

Quick Entry: When QUICK ENTRY is enabled, Doorcounts will only ask a salesperson one question: Did the interaction with the customer end in a sale, no-sale, or potential sale? Within less than 10 seconds of your salesperson’s time, Doorcounts calculates sales conversion, time with customers, and the breakdown of sale/no-sale/potential sales.

DUE TO POPULAR DEMAND WE HAVE EXTENDED OUR BOGO DEAL TO DECEMBER 4TH! For every store you purchase before December 4th, get one FREE! Every store purchased is another store FREE (if you only have one store get 50% off that store). Looking to upgrade? Get 50% off when you upgrade to Doorcounts 3.0 before December 4th! (If you’re already a DC 3.0 customer, reply to this email and we’ll perform a traffic analysis to help you turn your foot traffic into more sales.)

NOTEWORTHY NEWS

As you start your Wednesday, here’s a rundown of Black Friday…

The big 52: Not as a surprise to many, this year’s Black Friday saw a major drop compared to last year. Shoppers have begun to spread out their shopping rather than going big on Black Friday and risking large crowds.

Winners and losers: From online sales to curbside pickup, see how these retailers came out of Black Friday on top.

Ghost town Friday: For as long as I can remember, I would wait until after Black Friday and see all the crazy fights and crowds that break out over Black Friday on social media. This year, the aftermath resembled a ghost town rather than the biggest sales day of the year.

Black Friday all season long: Despite Covid 19 dramatically reducing foot traffic on big sales days such as Black Friday, it seems as if many retailers are picking up the trend of “Black Friday all season long.” The hope is that by spreading out the deals, shoppers can make their way to stores without fears of crowds.

RANDOM IRRELEVANCE

Loss of a great villain: David Prowse, the man to bring Darth Vader to life passes away.

World’s loneliest Elephant: In a time where everyone needs a friend, follow the world’s loneliest elephant’s journey to friendship.

Divided Internet: Everything we do online is turned into data, and now online data is extremely valuable. The United States was once the global data powerhouse, but who has the most data in the world now?

Harvard’s longest study on happiness: Researchers analyzed gigabytes of data to figure out what truly makes people happy.

Read More

Search Trakwell.ai (Formerly Doorcounts)