July 6, 2021
Retail Traffic Trends #33: How does your store stack up?

After an eventful month, we can finally take a breather and enjoy the fruits of July.
With father’s day and the 4th of July within the last month, there is much to debrief when it comes to analyzing traffic patterns and data. On top of the two holidays, warm weather and decreasing social restrictions set up the retail industry for a major sales month.
While you and your team start breaking down your own numbers, this week we take a deep dive into the industry averages for the month of June.
WHAT’S IN THIS WEEKS EDITION, YOU ASK?
- Warm weather and the impact on foot traffic patterns.
- The bittersweet outcome for the mattress industry.
- Making sales conversation effortless with difficult customers.
- Get our upcoming research reports.
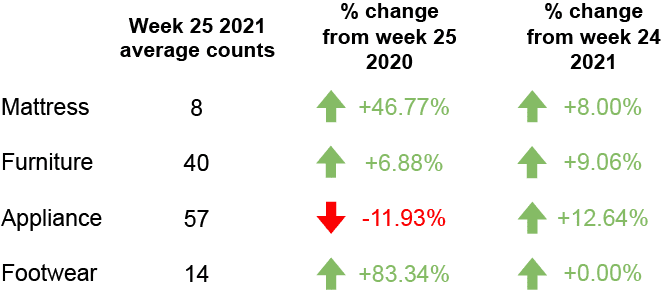
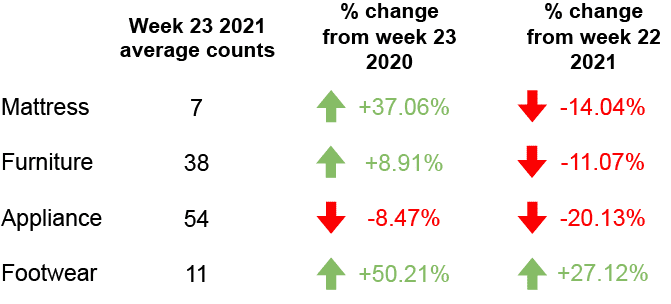
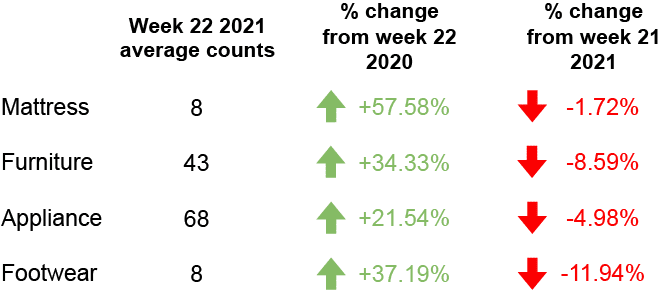
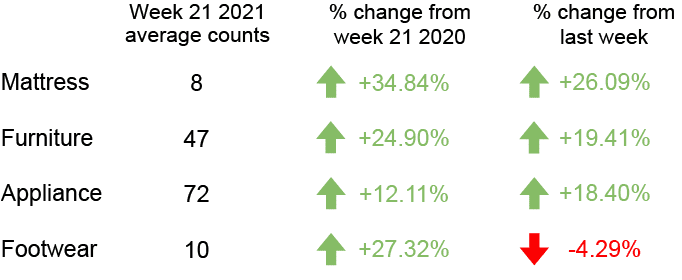
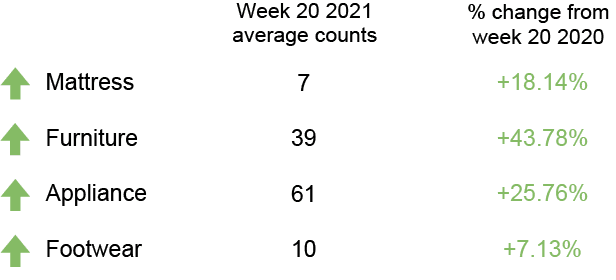
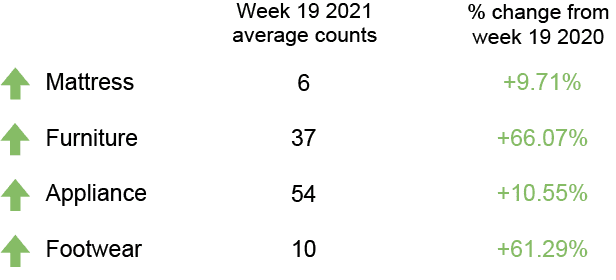
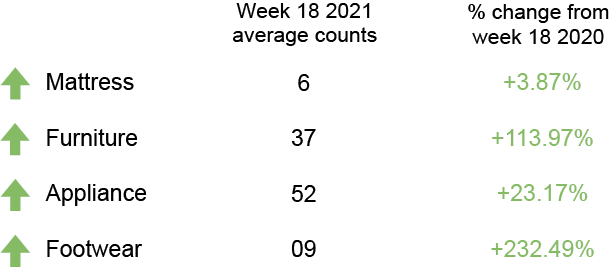
FOOT TRAFFIC INDEX
Here’s a look at last week’s foot traffic compared to the same time last year.
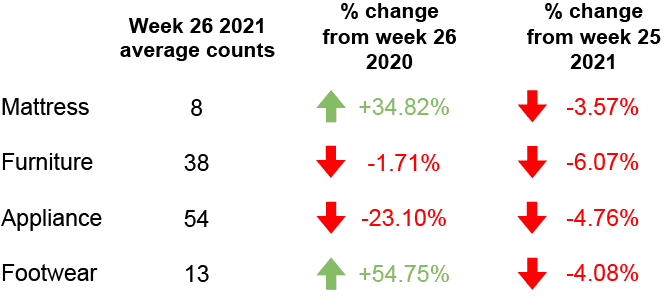

FOOT TRAFFIC TRENDS
Industry insights so you can convert your foot traffic into more sales.
Two steps forward,
One step backward
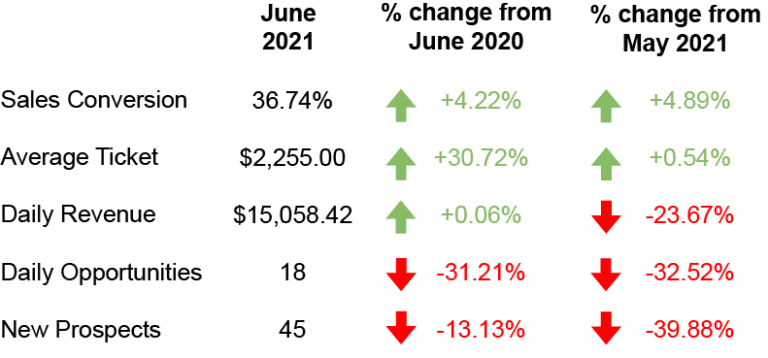
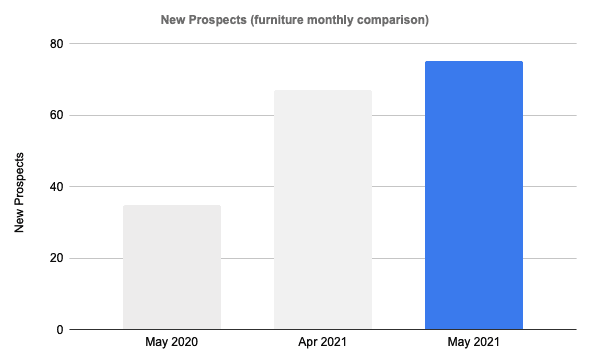
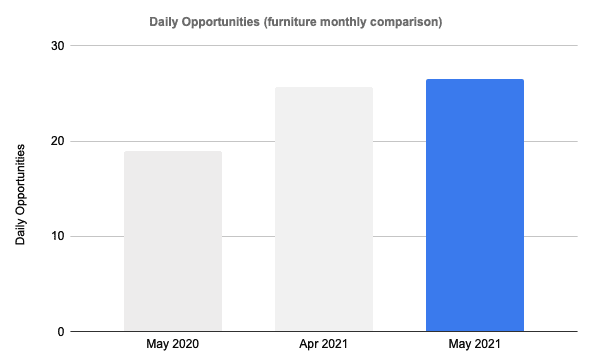
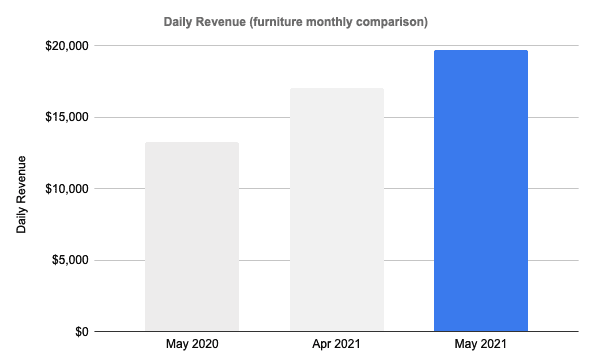
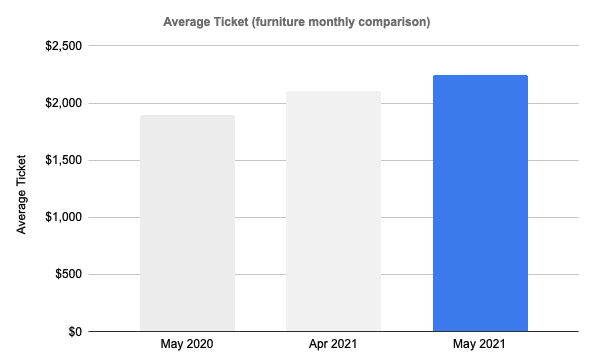
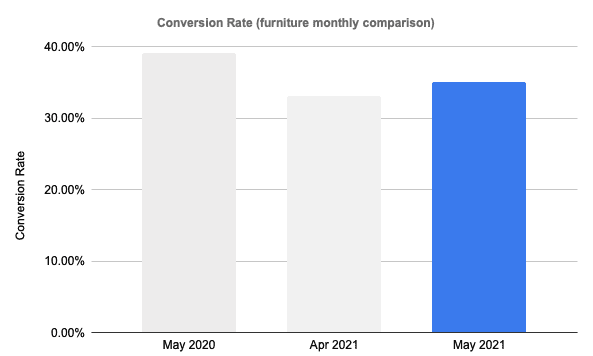
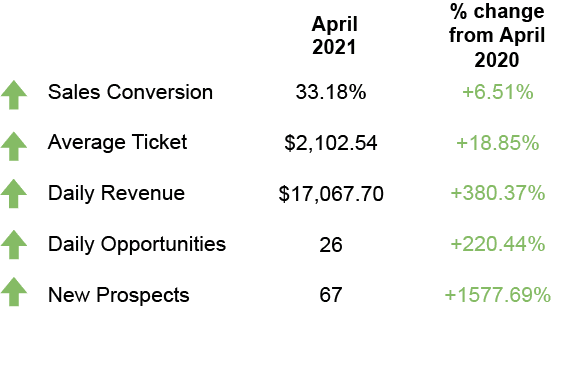
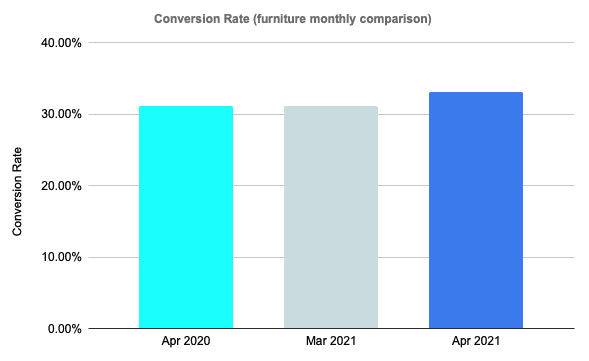
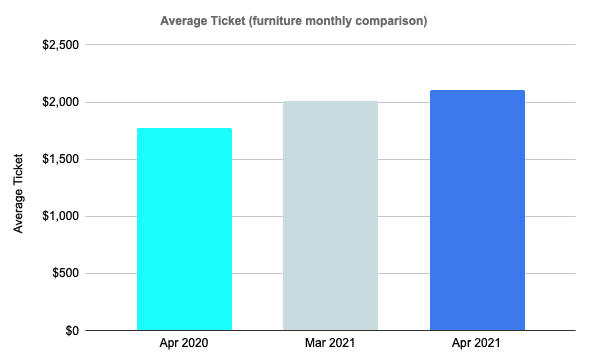
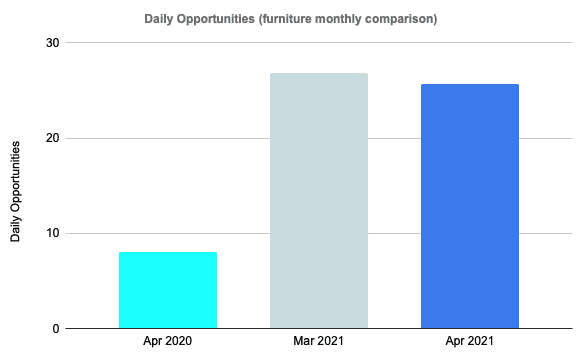
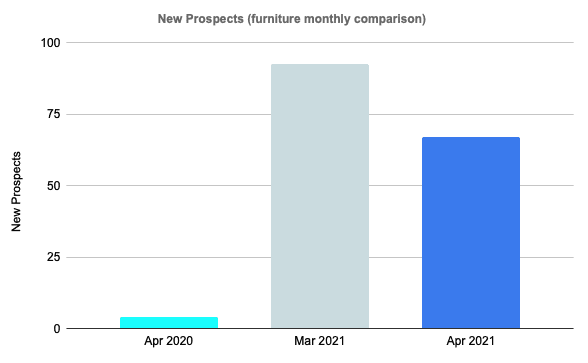
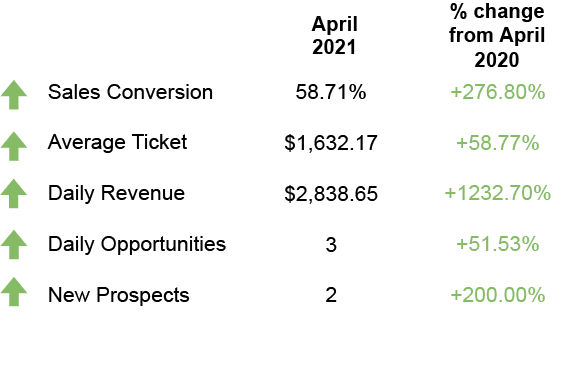
June 2021 was filled willed with sunshine, heat beyond imagine and reduced social restrictions across the country. For the furniture industry, June consisted of higher conversion rates and larger than the usual average tickets.
As the heat increased, people found themselves adding extra pieces of furniture to their homes while they stayed cool inside. Not only did average ticket see an increase of 31% compared to the lockdowns of June 2020, but also a minor increase of 1% compared to the month before.
While improvements from last year are important to note, we can almost guarantee an increase considering the state of the world in June 2020. It’s important to note that of all the metrics that are up compared to last year, foot traffic is not one of them.
Semi-surprisingly, foot traffic is down 31% compared to last year. While social restrictions were much more prominent last year, furniture was at the peak of its demand due to months of people staying at home.
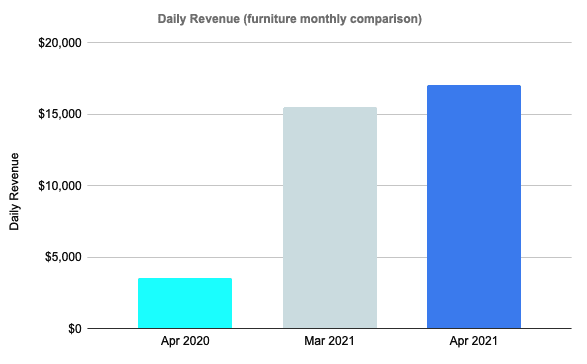
Even with the increased demand and foot traffic in June 2020, the furniture industry increased their average daily revenue by 0.06%. While the percentage is rather small, it holds huge value considering the circumstances.

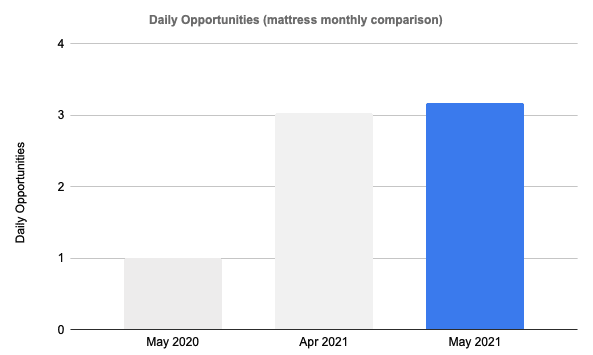
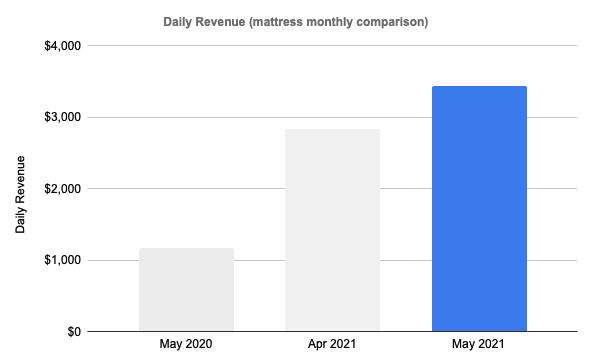
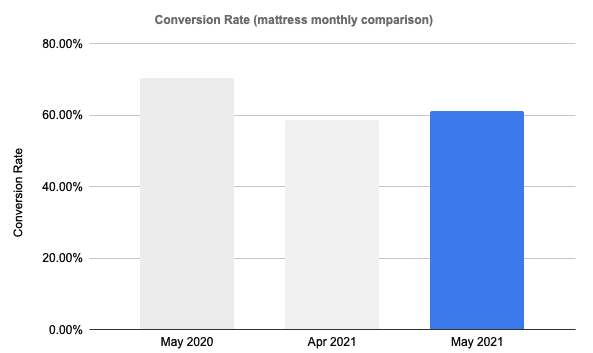
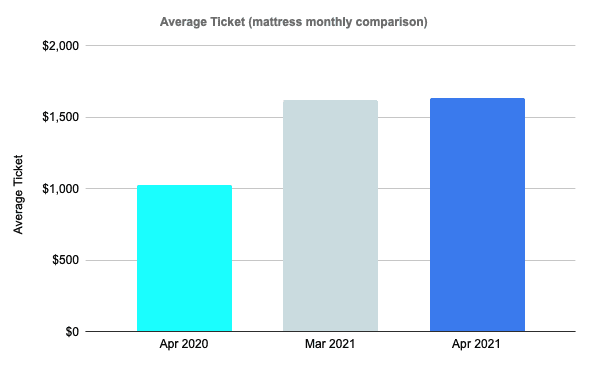
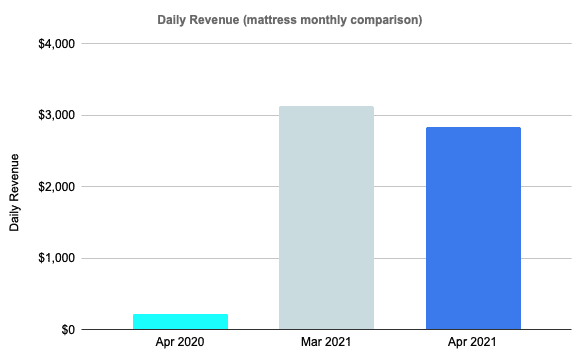
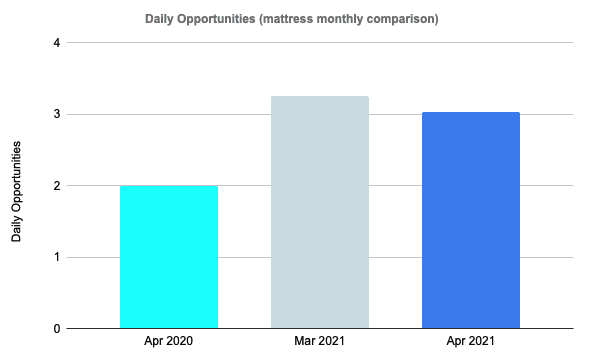
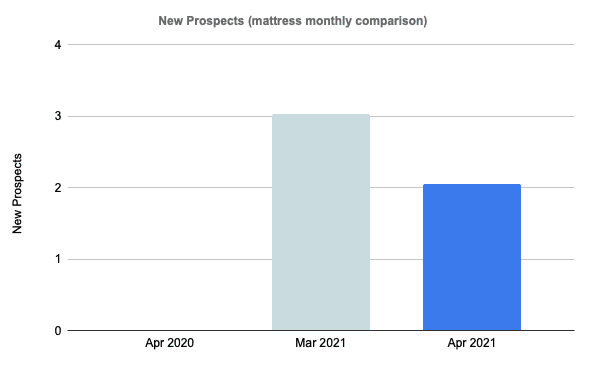
Mattress mayhem
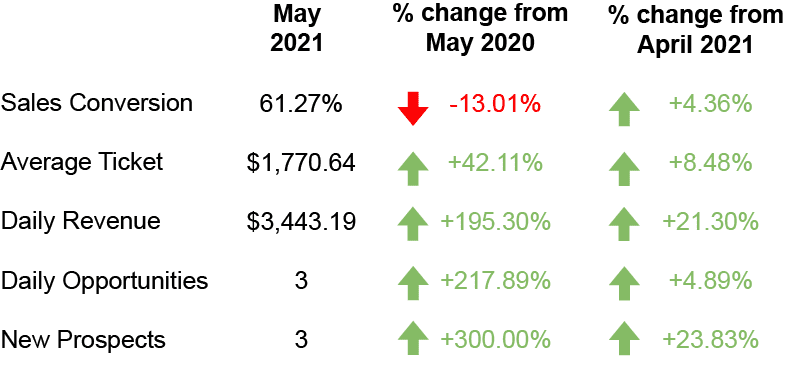
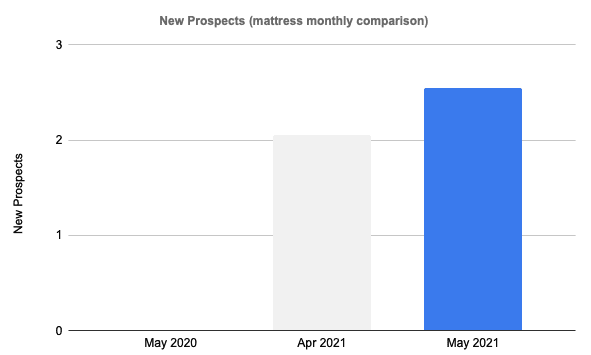
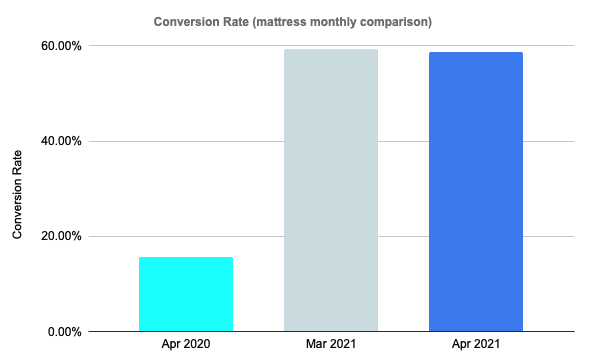
Similar to the furniture industry, June 2021 had a bittersweet performance.
To start off with some positive takeaways, the mattress industry saw an increase in every metric compared to June 2020. Not only was foot traffic up over 160%, but the people who came into the store spent an average of 22% more compared to June 2020.
Salespeople found their June groove and increased conversion rate by 0.08%, which was just enough to push the average conversion rate over 70%. The ability to sell to 7 out of the 10 people who walk through the door is a quick way to increase the year-over-year daily revenue by 130%.
Here the bittersweet part: 4/5 of the metrics saw over a 15% decrease compared to the previous month, May 2021.
On the bright side, sales conversion being the only metric with an increase tells us that the decrease is a result of external factors, not the result of poor sales performance.
NOTEWORTHY NEWS
A sales conversation: The 5 key takeaways for making better sales conversationafter someone made over 500 sales calls over the last two years.
Building better loyalty: Smart store technologies that are transforming retail experiences.
Caspers revenge: Casper has announced a retail partnership with Mattress Warehouse.
Beyond social: Simple LinkedIn tools that could boost your sales.
RANDOM IRRELEVANCE
Evolutionary breakthrough: A Massive skull found in China might be a new human evolutionary branch.
Nathan’s dogs: The infamous Joey Chestnut wins his 14th title and sets a new world record.
Crabby texture: A new facility will produce bio-based textile treatments derived from crab and shrimp shells.
New dawn: Jeff Bezos picks a female aerospace pioneer to launch into space with him.