March 8, 2021
Retail Traffic Trends #16: Average ticket up 15% in February

This week we look at how the mattress industry compared to last month and how the furniture industry has evolved since last February.
WHAT’S IN THIS WEEKS EDITION, YOU ASK?
- See how the furniture industry has changed since last February
- How the mattress industry compared to last month
- Cost-effective marketing tools
- Dos Marcos introduce us to the new home of the show: FAM.news
- Turn your foot traffic into more sales with a 90-day free trial of Doorcounts 3.0.
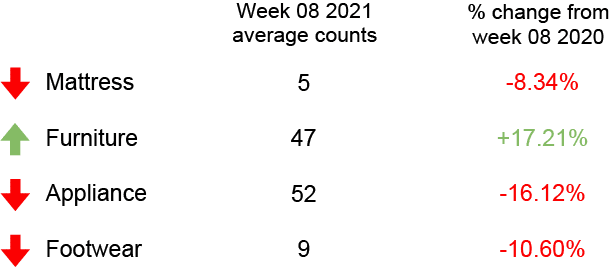
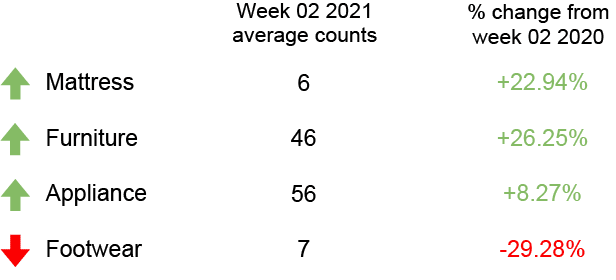
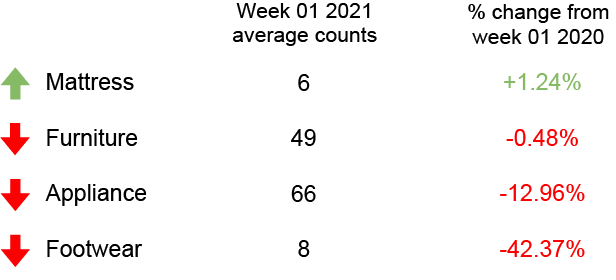
FOOT TRAFFIC INDEX
Here’s a look at last week’s foot traffic compared to the same time last year.
DC FEATURE OF THE WEEK
This is where each week we highlight a feature within Doorcounts. This week’s feature is:
As you start each month, it’s always good to look at the previous month to see what went well and what needs to be improved upon.
The Monthly Statistic tab shows you a comparison of each month with the metrics that you select.
Monthly statistics can be compared at both a location and employee level.

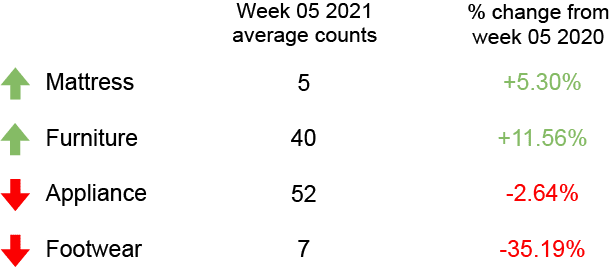
FOOT TRAFFIC TRENDS
Industry insights so you can convert your foot traffic into more sales.
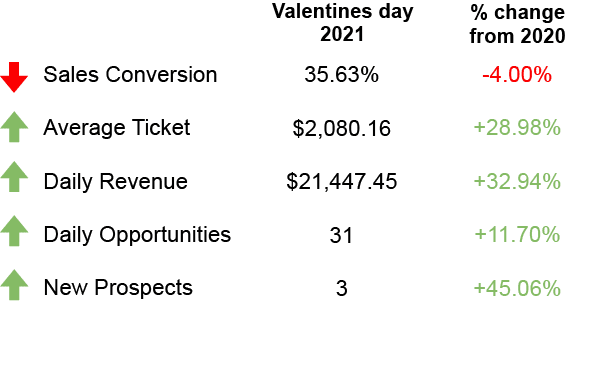
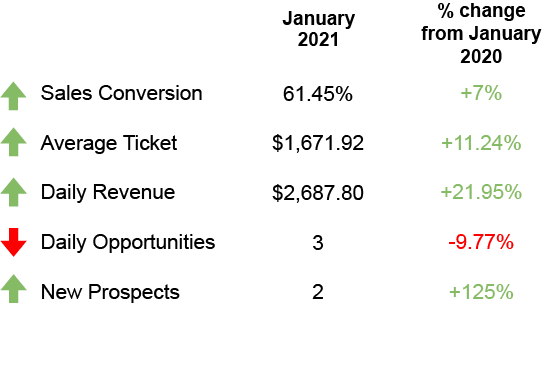
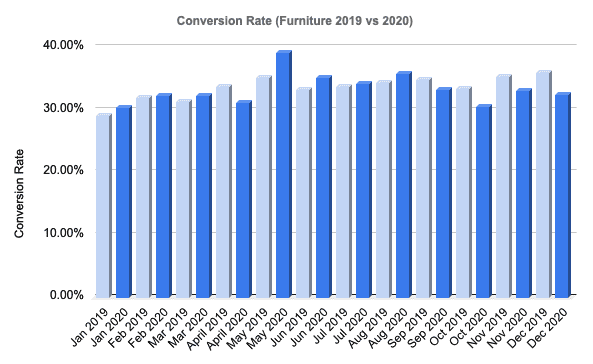
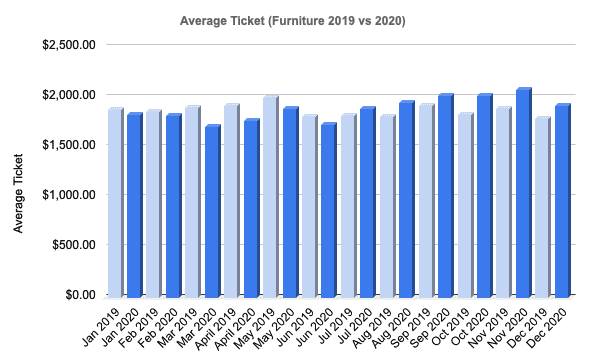
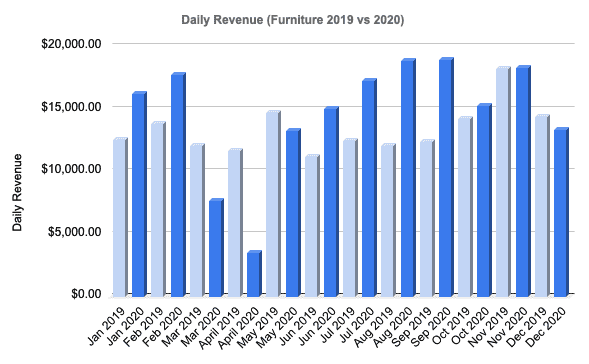
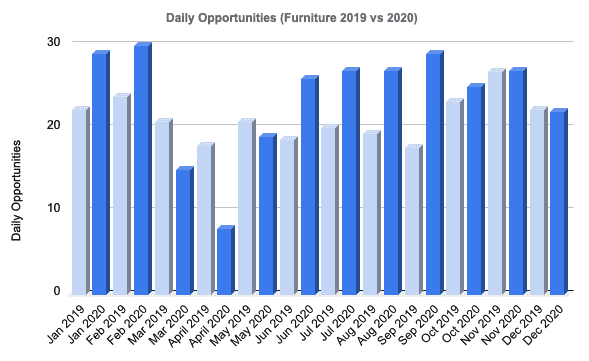
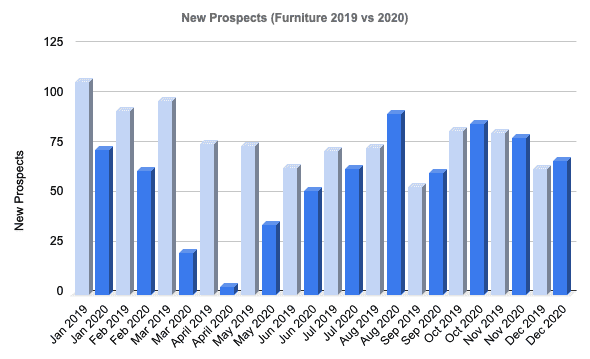
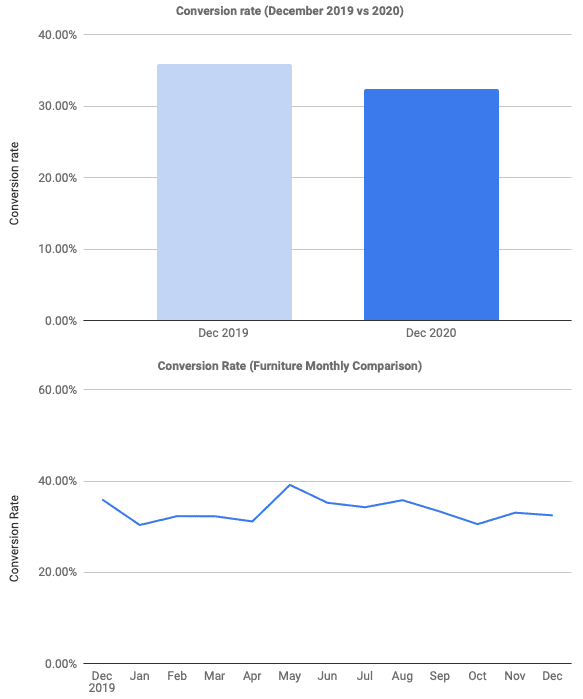
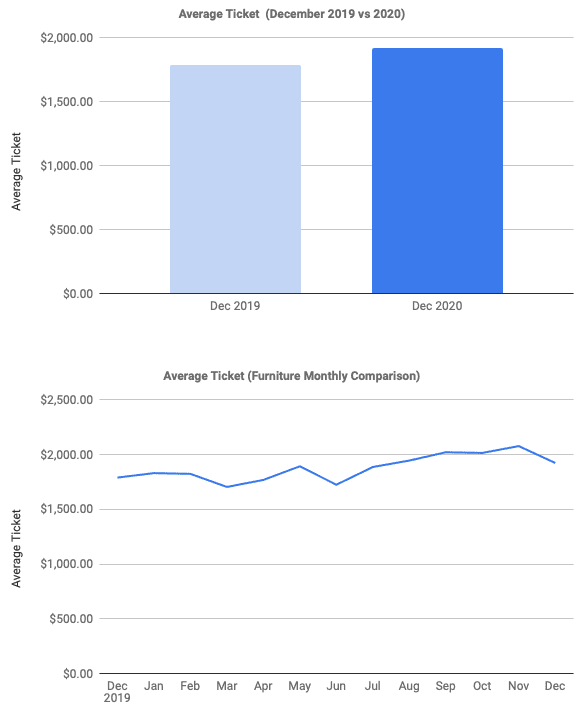
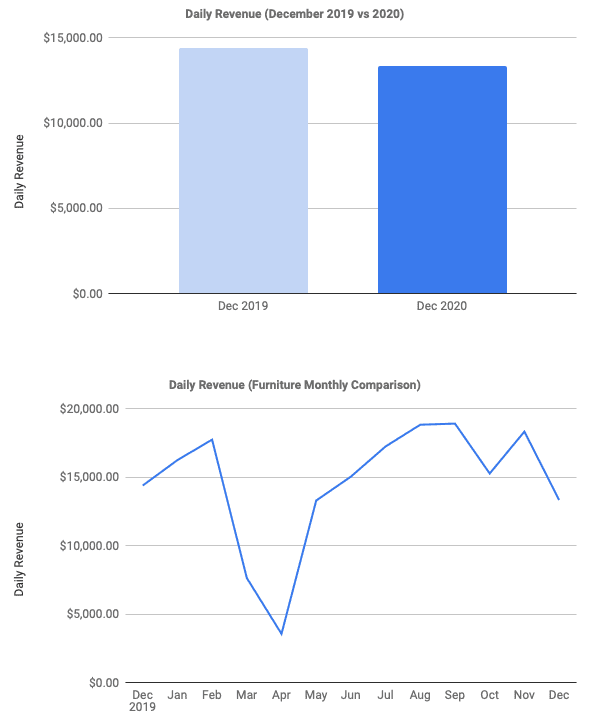
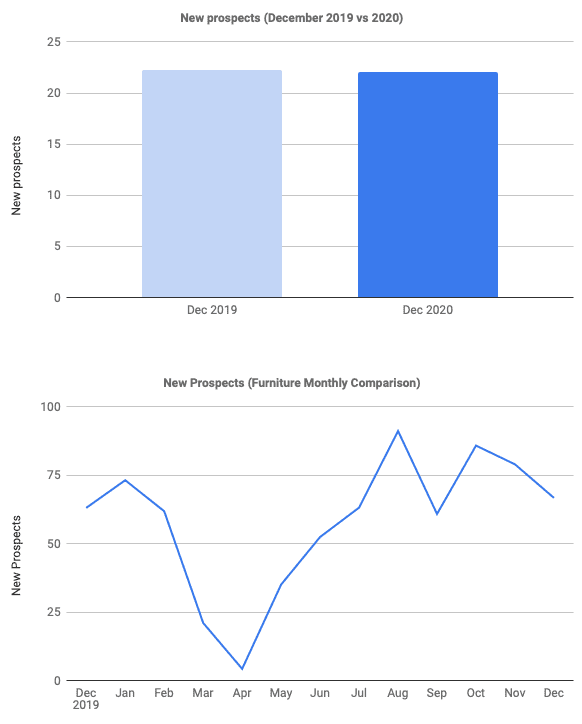
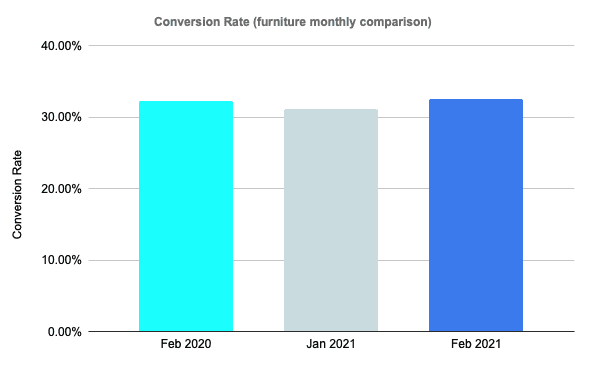
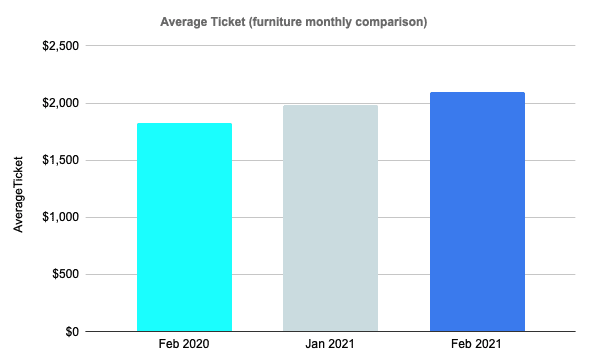
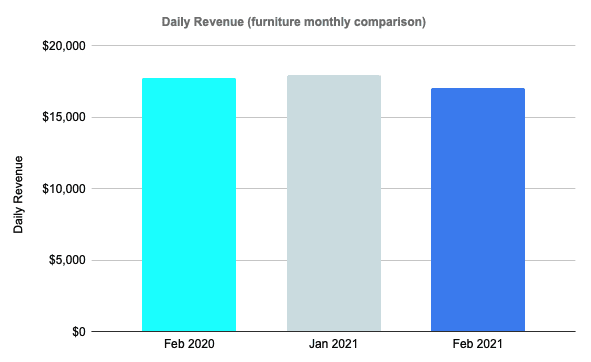
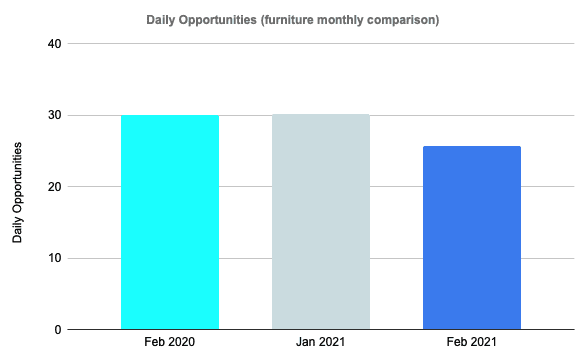
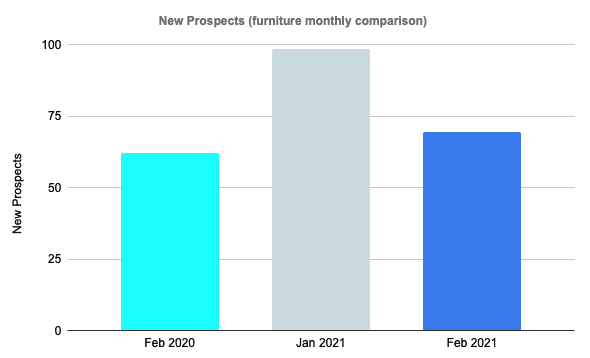
February furniture key metrics
February is yet another month that gives us hope that the retail industry is slowly returning to normal.
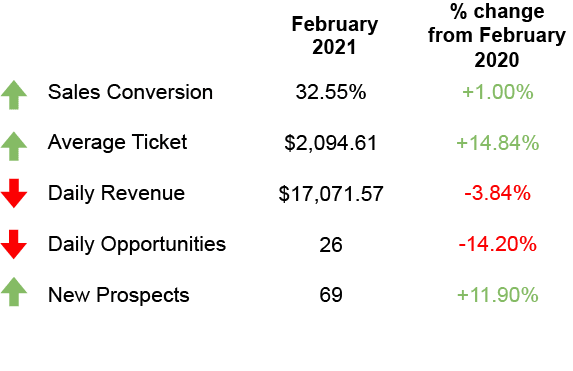
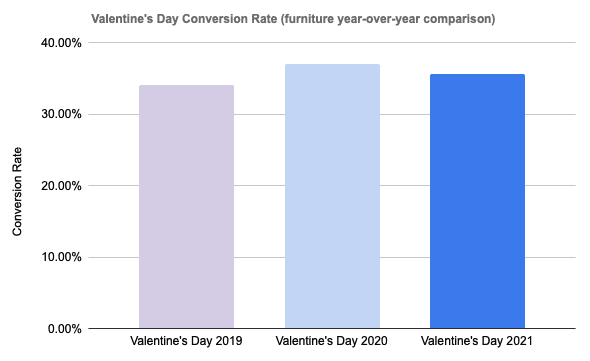
Conversion rate up 1%: Although the conversion rate is up 1% from February 2020, the furniture industry also saw a 4% increase from last month.
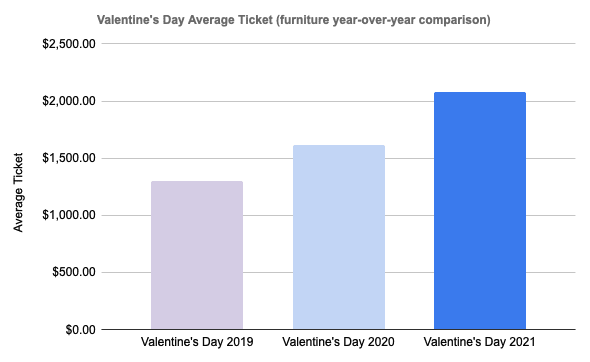
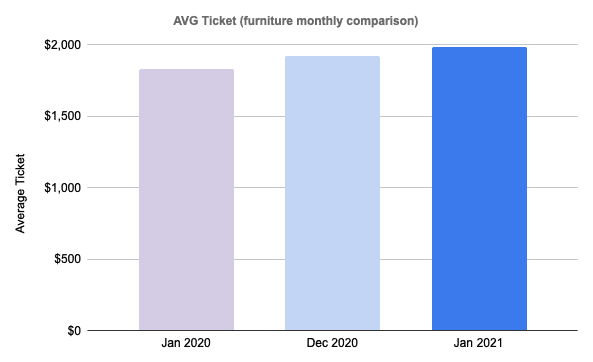
Average Ticket up 15%: Average ticket has stayed strong with a 15% increase year-over-year and a 6% increase from last month.
Daily Revenue down 4%: Average daily revenue went from $17,754 last February (2020) to $17,071 in February 2021. Compared to last month, average daily revenue saw a similar drop with a 5% decrease.
Daily Opportunities down 14%: Daily opportunities are the total shoppers who visit your store. Although most metrics rely on people coming into stores, an increase in sales conversion can level out the 14% decrease in foot traffic since February 2020.
New Prospects up 12%: As we’ve said in the past, new prospects are people who left the store without buying. We’ve seen 12% more customers leave the store without buying in comparison to last February and 30% more since last month.
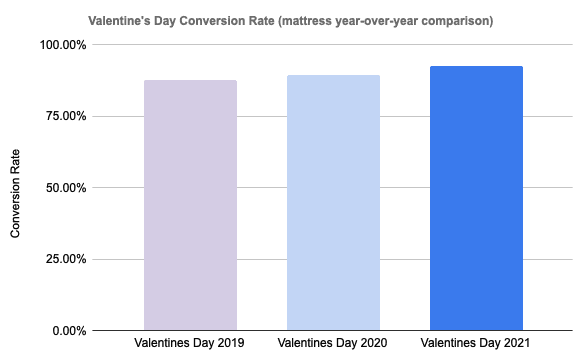
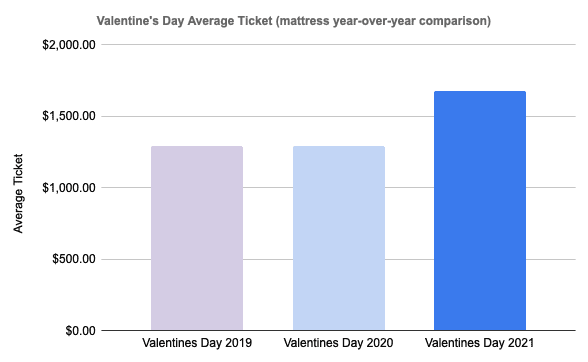
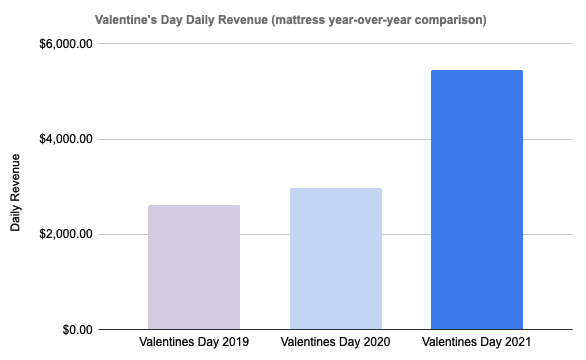
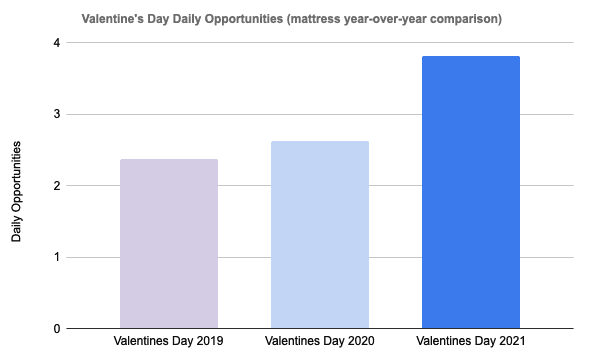
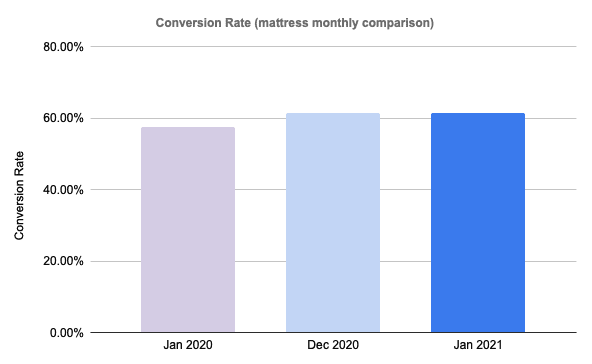
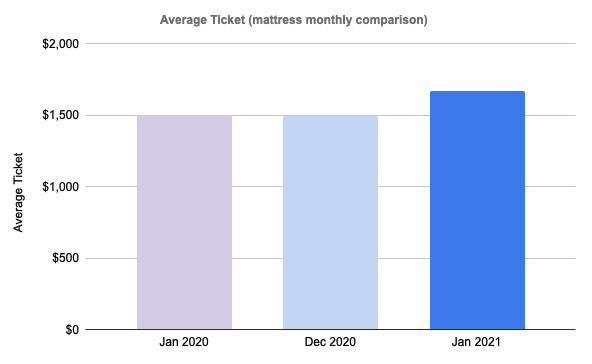
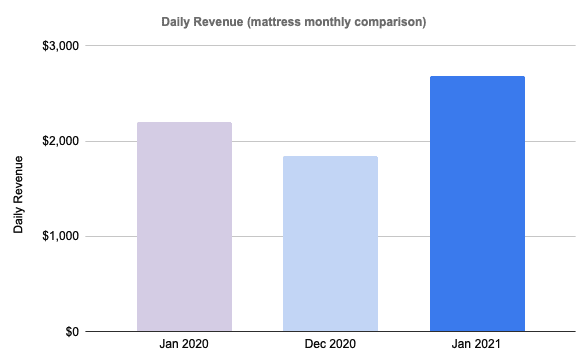
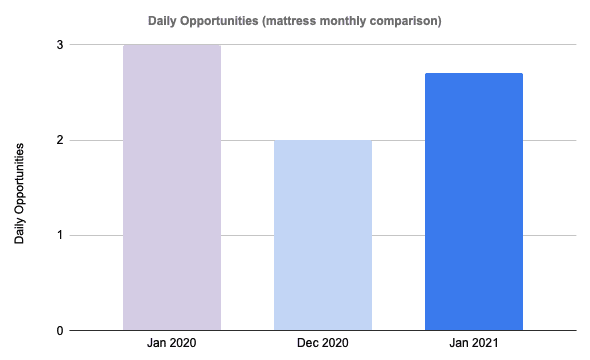
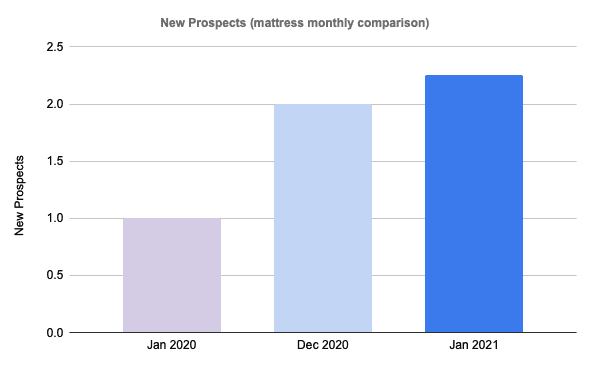
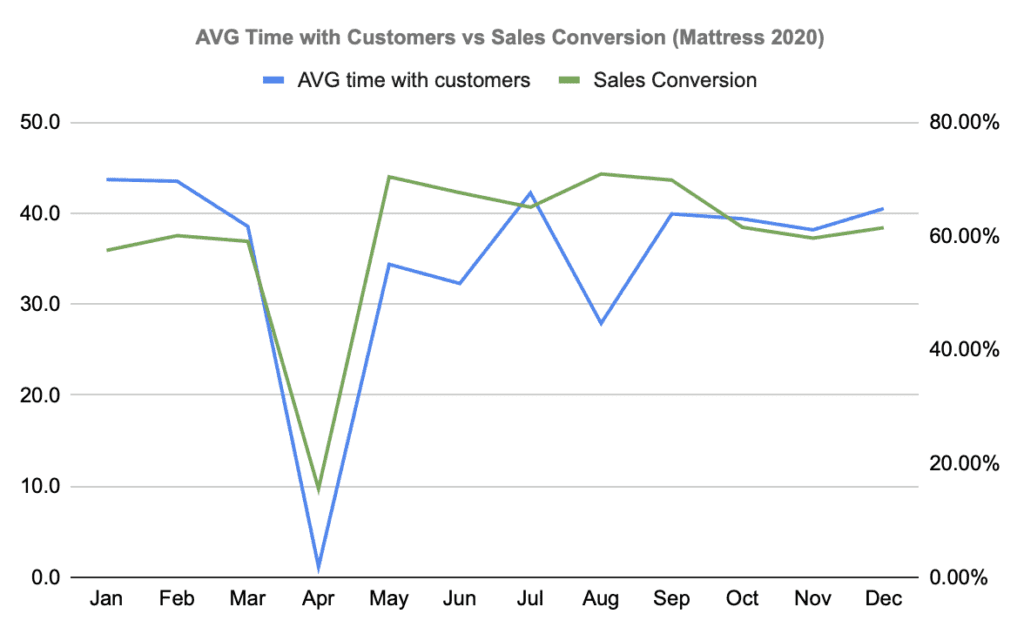
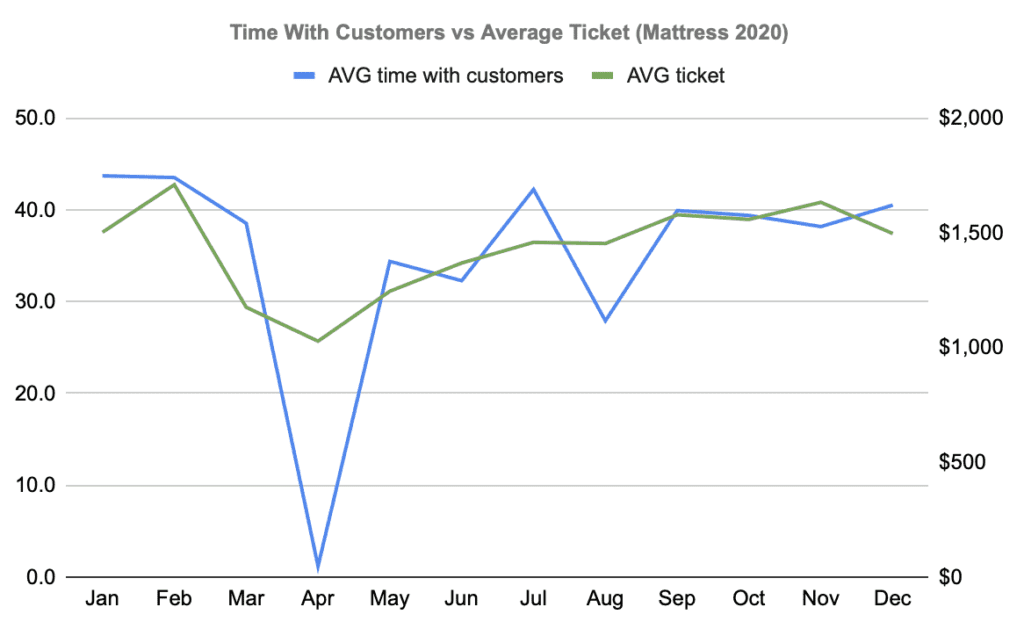
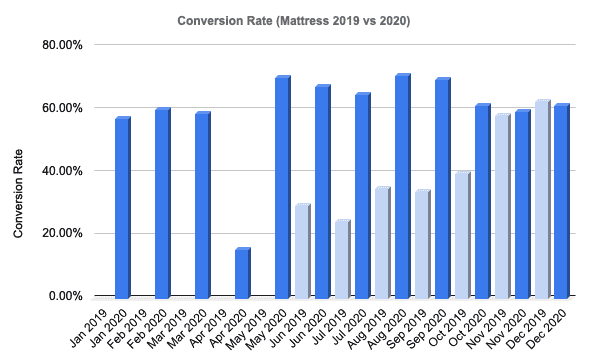
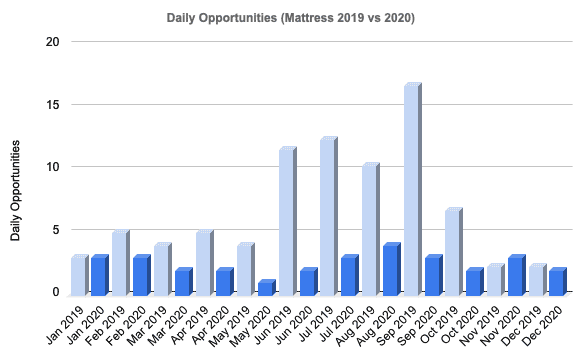
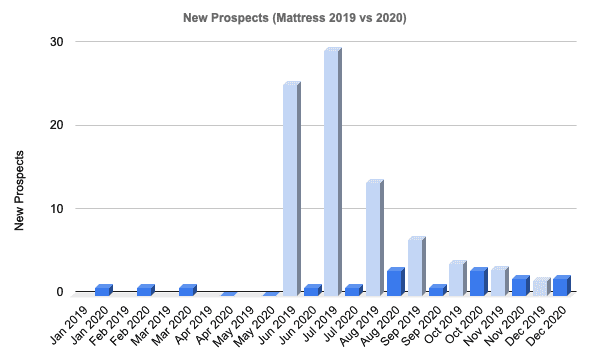
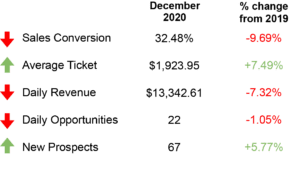
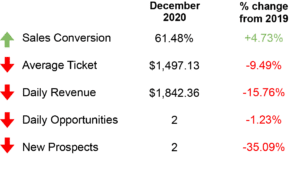
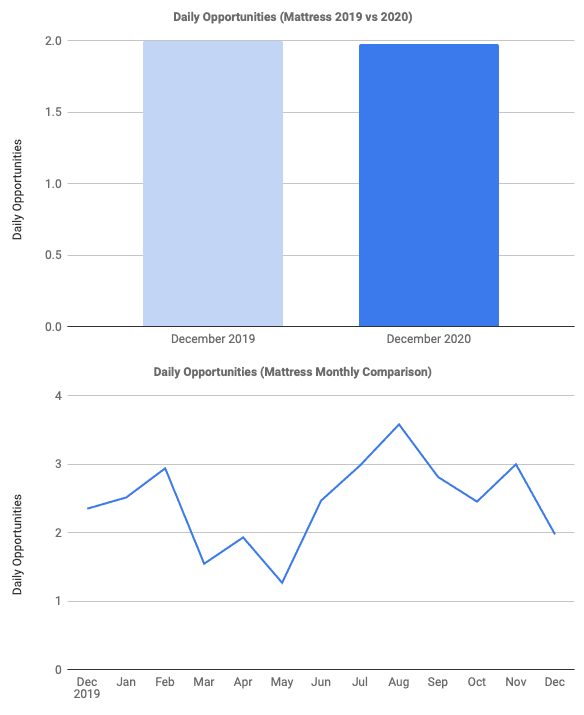
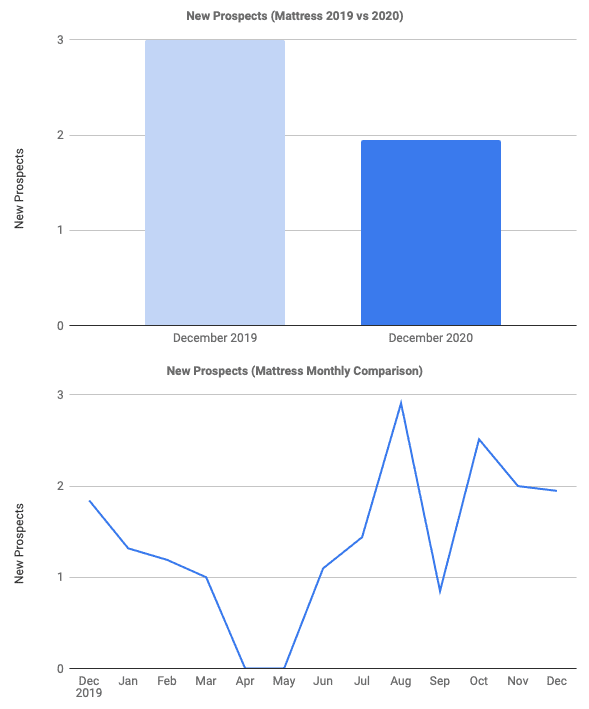
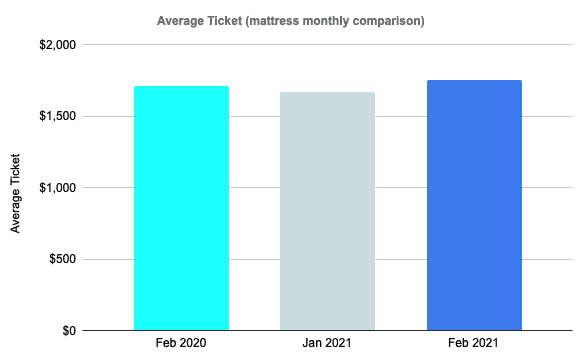
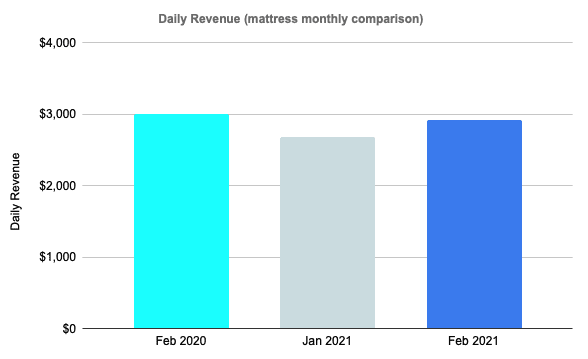
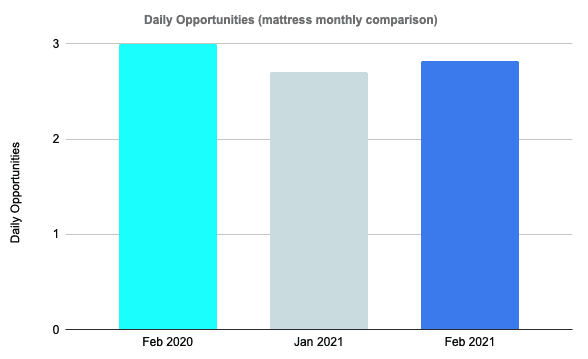
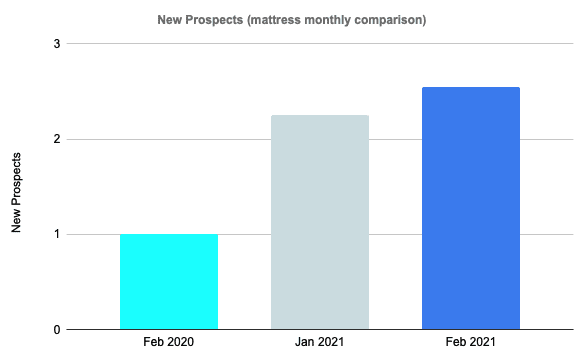
February mattress key metrics
Unlike the furniture industry, the mattress industry was in the red in nearly all metrics despite an increase in new prospects — which is not a good thing.
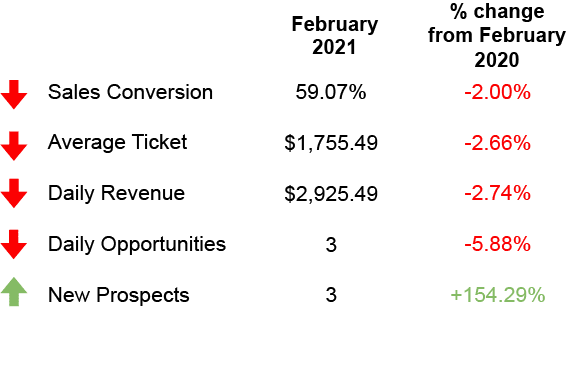
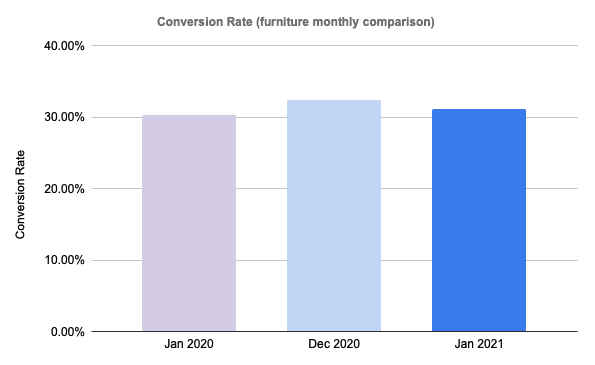
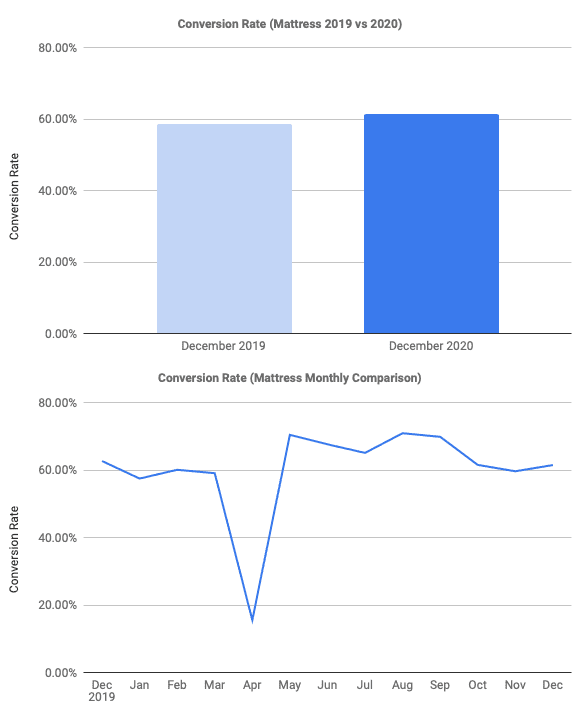
Conversion rate down 2%: The mattress industry not only saw a 2% decrease compared to February 2020, but the conversion rate saw a 4% decrease compared to last month (January 2021).

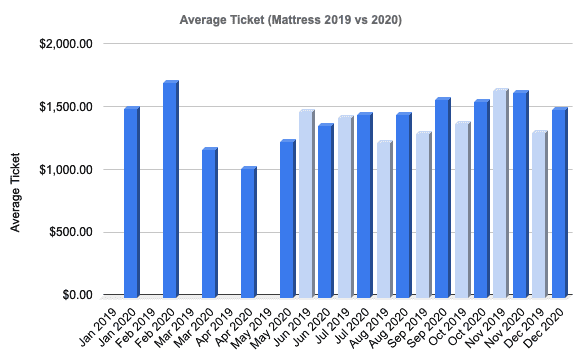
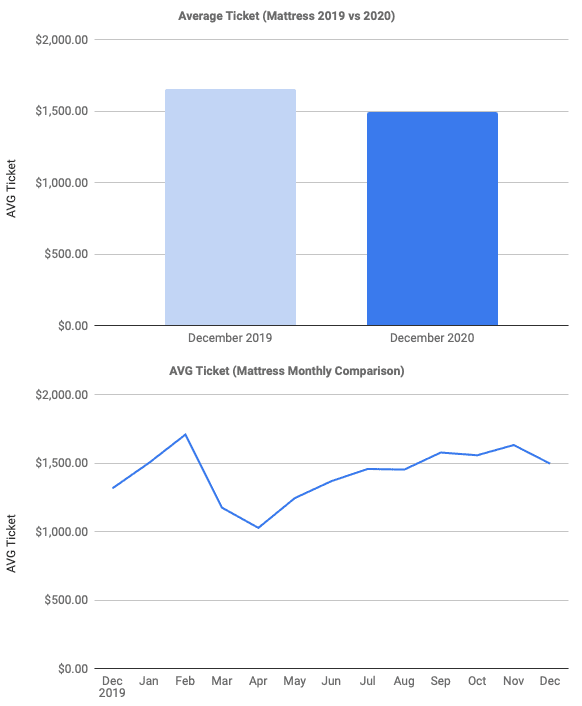
Average Ticket down 3%: Although average ticket saw a slight decrease of 3% compared to February 2020, February has the highest conversion rate of 2021 so far. Given there have only been 2 months in 2021, a 5% increased compared to January 2021 is a good sign for the months to come.
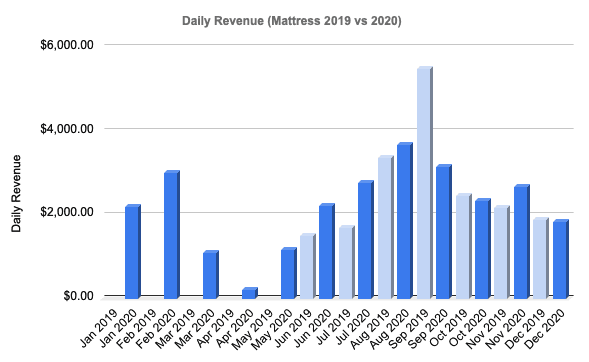
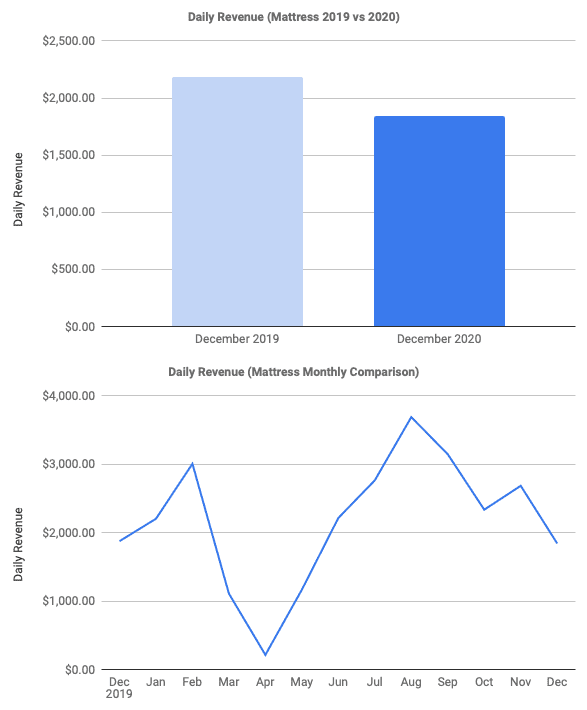
Daily Revenue down 3%: If both conversion rate and average ticket are down, it’s an uphill battle to keep daily revenue afloat. Daily revenue isn’t the same as it was last year, but compared to last month, the mattress industry saw a 9% increase in daily revenue.
Daily Opportunities down 6%: Foot traffic still struggles to see the levels they were at in February 2020. Daily opportunities saw a decrease of 6% year over year and a similar decrease of 4% compared to January 2021.
New Prospects up 154%: As we’ve said, new prospects are customers who left the store without buying. To put the 154% into perspective, new prospects went from one customer to three customers in the last year. Thankfully, new prospects only saw an increase of 13% increase since January 2020.
DOS MARCOS MATTRESS PODCAST
This week the Dos Marcos Mattress Podcast introduces you to the new home of the show: FAM.news!! FAM=For All-things Mattress is the first-ever all audio media platform delivering you written and audio versions of every news source, article, and sleep education piece posted on the site.
NOTEWORTHY NEWS
RANDOM IRRELEVANCE